Clash matrix and clash history for Navisworks
Set up the clash tests in Excel. Track them there too.
Save the clash matrix from your selection set folders, fill in the tolerances, and load it back as clash tests. Then append each Standard, Assigned To or Detailed export to a history workbook so trends, burndown, and resolved-per-week come out of Excel or Power BI.
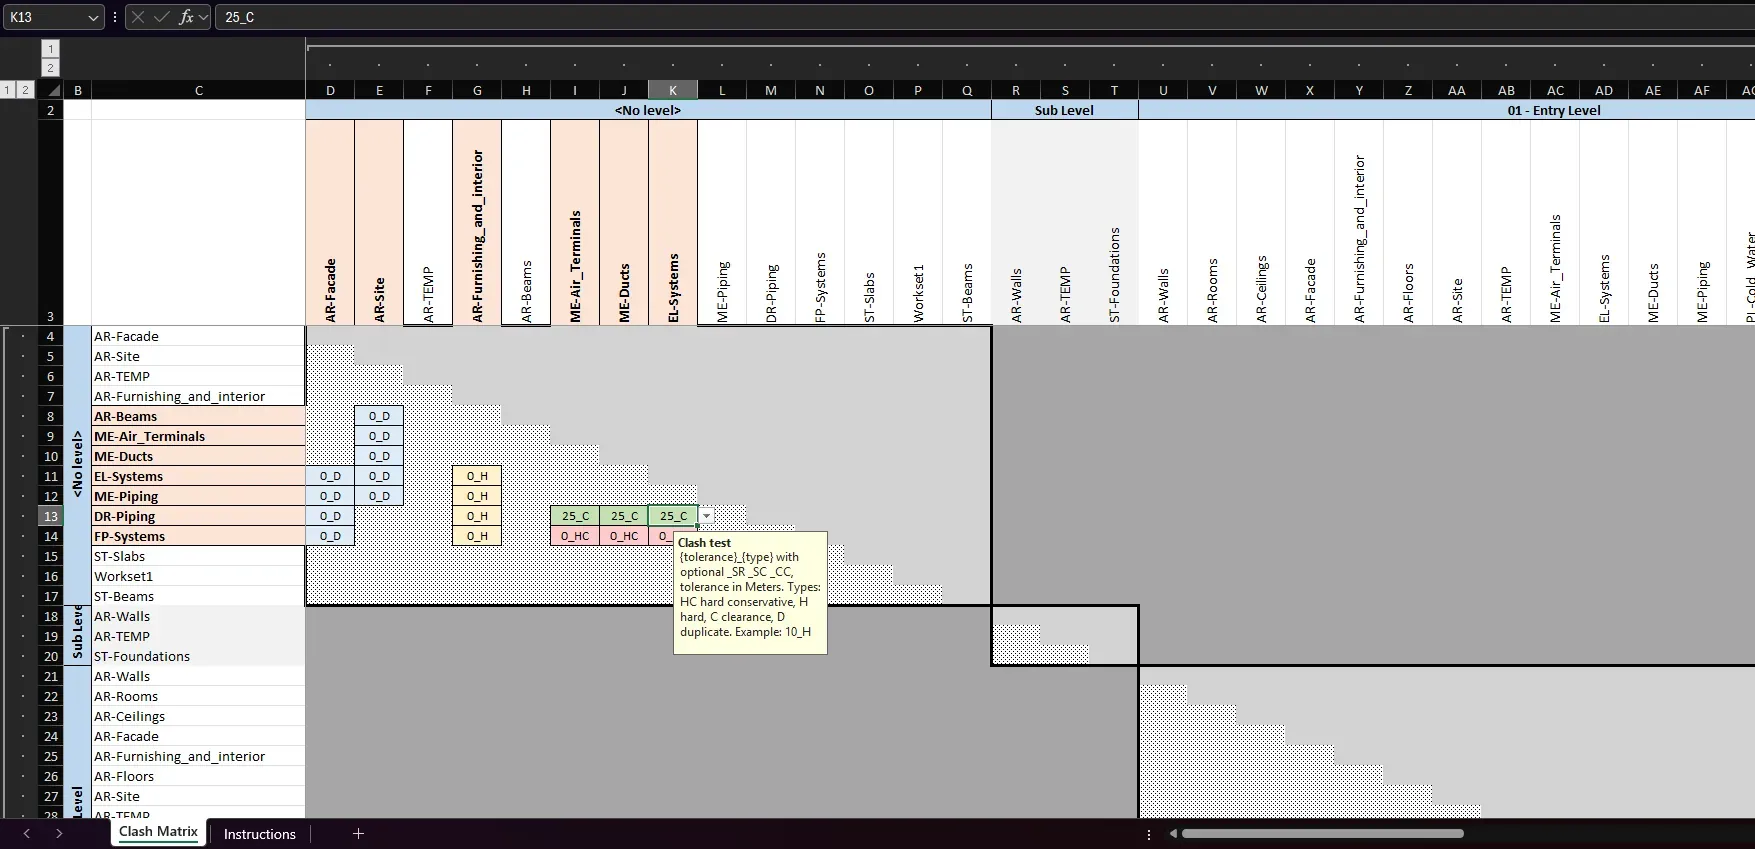
Clash matrix
From selection set folders to clash tests, through one workbook.
Save Matrix and Load Matrix are two ribbon buttons in the Clash Manager panel. The Excel file in between is the coordination plan: who is tested against whom, at what tolerance. Both buttons handle nested folders, and Load Matrix previews the load and updates existing tests in place.
- 01
Save Matrix
Pick a selection set folder: its sets go on both axes of an Excel matrix, with an Instructions sheet that explains the cell format. Up to two levels of sub-folders under the chosen folder become grouped headers in the matrix, so a Level > Discipline > System tree reads the way it is organised. The pairs can be limited to sets in the same group, so L01 structure is only paired with L01 services, each cell has a drop-down of common presets, a legend sits below the grid, and the Instructions sheet names the unit.
- 02
Fill it in
Each cell holds a tolerance and a type, for example 10_H or 50_C: Hard, Hard Conservative, Clearance or Duplicate, with optional flags to self-intersect either set or merge composite objects. Leave the pairs you do not want tested empty. The workbook is plain Excel, so it can be reviewed and signed off by the coordination lead before anything reaches the model.
- 03
Load Matrix
Load Matrix creates one clash test per filled cell. A set that was renamed or moved after saving is still found through its hidden id. A preview states how many tests will be created, updated, or skipped before the document is touched. Edit the tolerances and load the workbook again: existing tests are updated in place and keep their results and statuses. Tests are named from the set paths (L01/STR vs L01/MEP, or L01: STR vs MEP), a bad value is reported with its exact cell, and the load can be cancelled part way.
On Navisworks 2027, Load Matrix creates a clash test folder per level. Tests placed in folders are listed in the Clash Manager pane with a Folder column and in the Clash Results test drop-down as Folder/Test, and batch update, rename, and every report include them. The demo files include a pre-filled demo matrix for the demo model, with hard tests between structure, architecture and services and a clearance test between electrical and water systems, to try the round trip before a project model.
Matrix report
The clash count, set by set.
The Matrix report in Clash Manager puts the checked tests on a selection-set-by-selection-set grid, the same layout the matrix was planned in. It is the sheet to bring to the coordination meeting.
- One sheet for the total and one per status, optionally one per assignee
- Group subtotals and a colour scale across the grid
- A hover comment on each cell lists the tests behind the number
- Tests whose sides are not saved sets are matched by name. Those that still cannot be placed are listed on an Other tests sheet with the reason.
Clash history
Standard, Assigned To and Detailed exports can append a dated snapshot.
Each Standard, Assigned To or Detailed export can append a dated snapshot to a history workbook beside the model. History_Summary holds the counts per test and status, and the Detailed report can add one row per clash to History_Clashes. When the workbook already holds an earlier snapshot, the Summary sheet gains delta columns. The Detailed sheet shows how each clash's status changed since the last snapshot, for example Active to Approved. The Delta sheet lists every clash resolved since then.
- Where it lives
- beside the model, or any workbook you pick
- Fed by
- Standard, Assigned To and Detailed exports
- At each export
- Append a dated snapshot, or Skip
- History_Summary
- counts per test and status, every export
- History_Clashes
- one row per clash, Detailed with clash rows on
- Since column, Detailed
- New, Persisting, Persisting (moved), Reappeared, Resolved
- Status Change, Detailed
- per clash, for example Active to Approved
- Delta sheet, Detailed
- resolved clashes, counts by test, level, assignee
- Baseline guard
- warns before mixing model, unit or group setting
- Reads it natively
- Excel pivots, Power BI
The default workbook is named after the model and saved beside it. The workbook records the model, display unit and group-count setting it was made with, and warns before a later export would mix them. A renamed test keeps its history.
Watch it run
Save Matrix and Load Matrix, inside Navisworks.

The Clash Matrix tutorial shows the Save Matrix and Load Matrix round trip. The nested folders, the preview, the Matrix report and the history workbook are described on this page until the video is updated.
Questions
What coordinators ask about the matrix and the history.
Does the history workbook change my clash tests?
What happens to the history when a test is compacted, rebuilt or renamed?
How large does the history workbook get?
How do I get the history into Power BI?
Which Navisworks versions and editions are supported?
Looking for the grouping side of the workflow? See clash grouping by level, grid, or property.
Try it on your next coordination run.
30 days, unrestricted. Download it from the Autodesk App Store and run the installer; no administrator rights needed.