Skip to content

Schedule

Gantt chart and critical path inside Navisworks

The Schedule pane shows a schedule as a Gantt chart docked in Navisworks: a task grid on the left, bars, relations, float and the critical path on the right. The schedule comes from Generate Timeline or from a Primavera P6 XER or Microsoft Project XML file. Select its critical tasks in the model, colour the model by level or trade, edit it in place, write it into TimeLiner for the 4D simulation and save it back for P6 or Project.

Navisworks Manage and Navisworks Simulate, Navisworks 2021 to 2027 Autodesk App Store
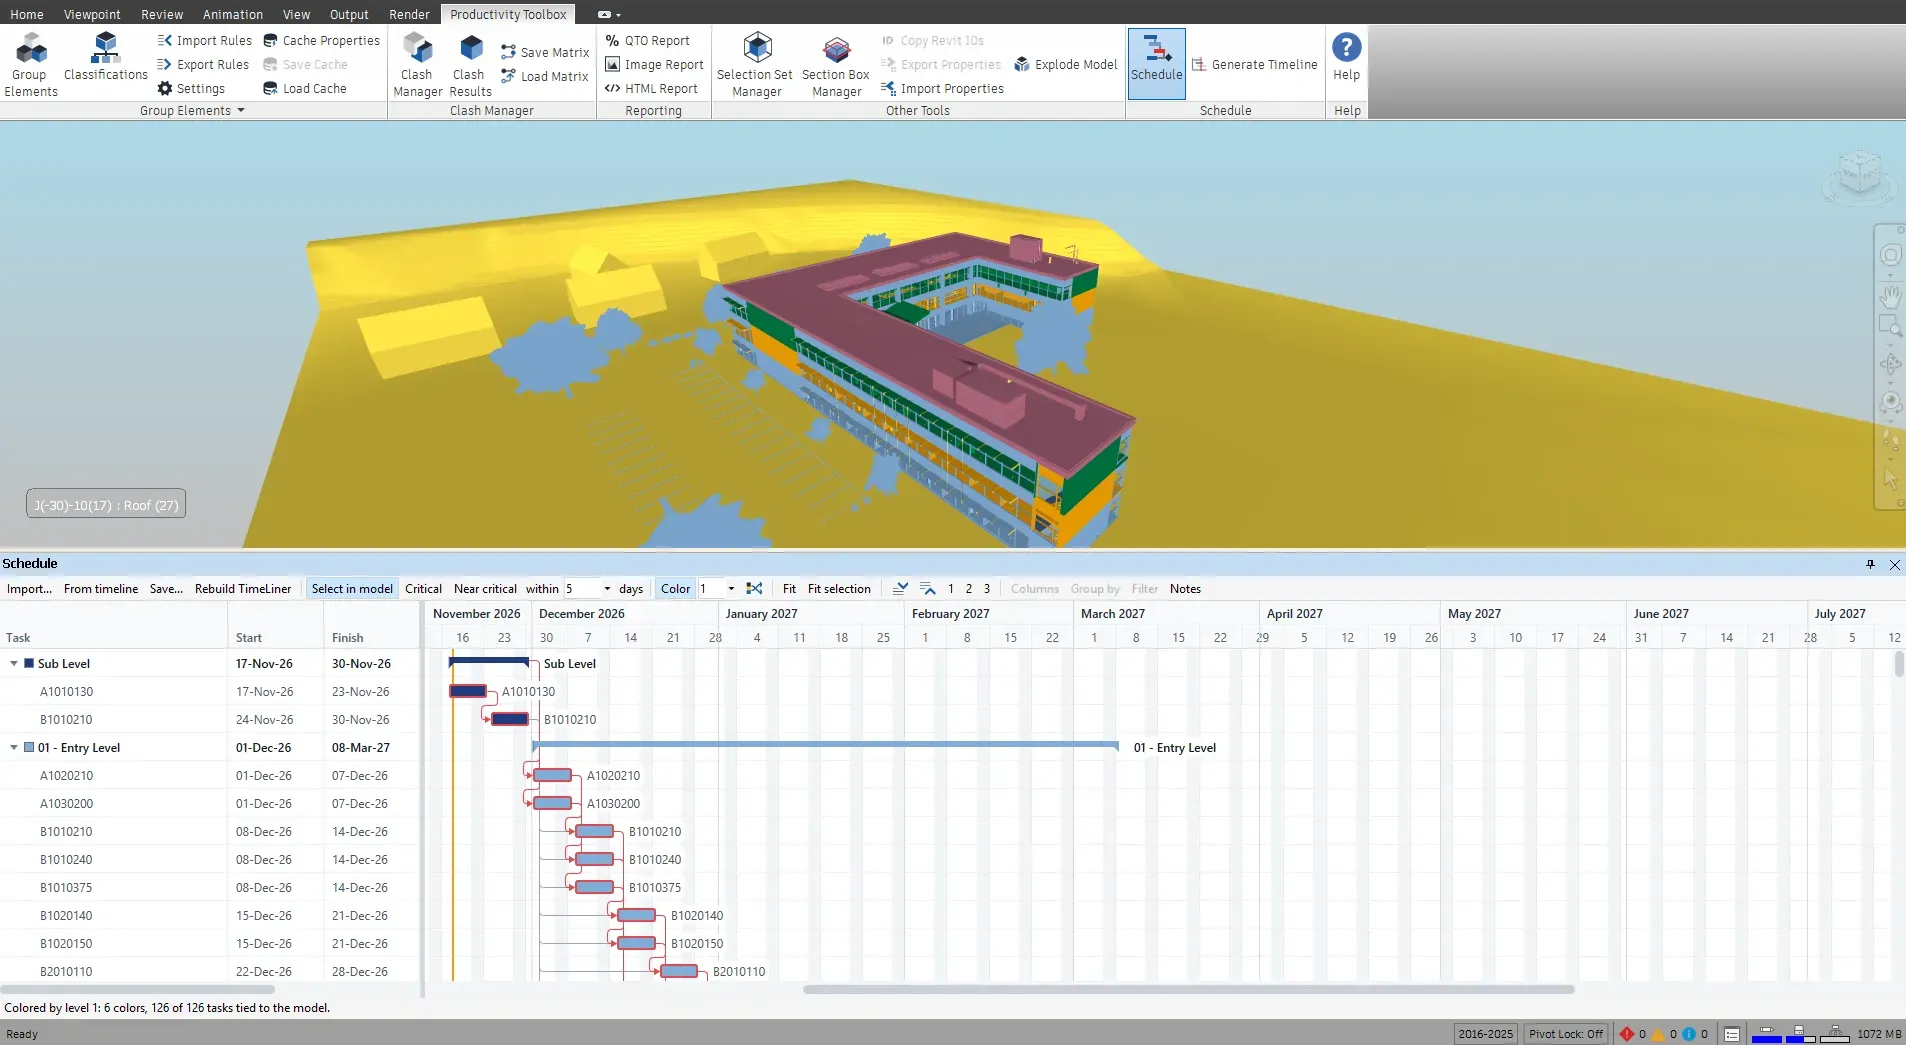
Schedule pane docked under the model with a generated timeline as a Gantt chart: tasks per level, relations as arrows, critical tasks in red, and the model coloured by level

What it does

A Gantt chart inside Navisworks, tied to the model

A dock pane with a Gantt chart of a generated timeline or an imported P6 or Project schedule: relations, float, critical path, editing, model colouring and a round trip to TimeLiner.

  • Imports Primavera P6 XER, Microsoft Project XML and its own schedule file, and saves to all three
  • Critical tasks in red, total float drawn after each bar, and Near critical selects the tasks within 1 to 30 days of float
  • Select in model: picking rows selects the elements of their selection sets, so the critical path shows in 3D
  • Colour the model by any outline level of the schedule, one colour per level or per trade, on the elements the tasks are tied to
  • Edit in place: type in cells, drag bars and their ends, draw relations between bars, insert, delete and indent tasks. The schedule recalculates after every edit and Ctrl+Z undoes it
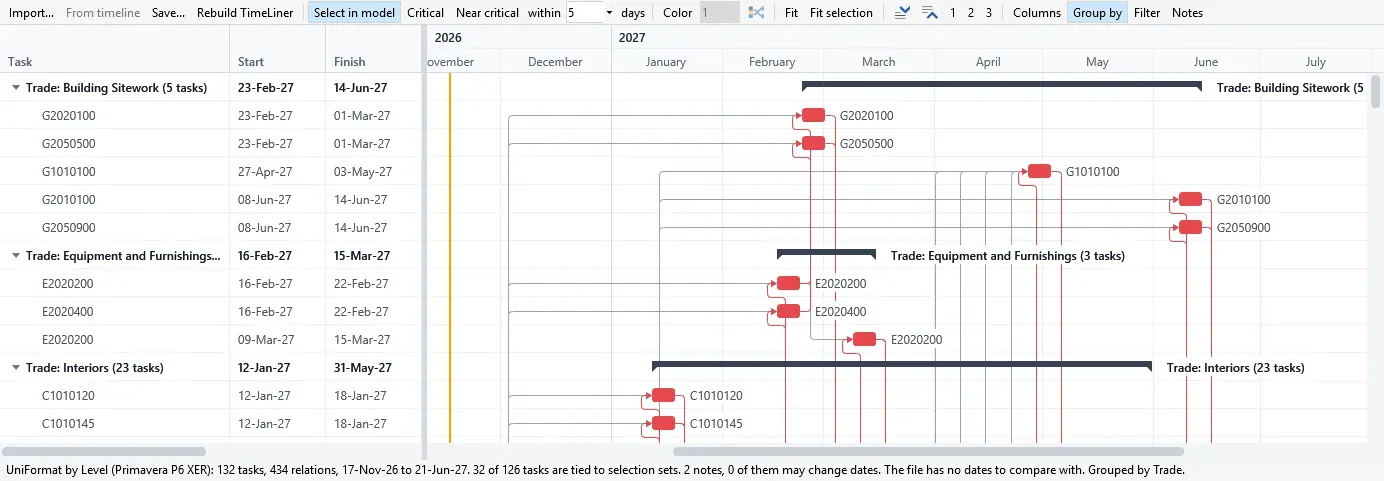
  • Group and filter by P6 activity codes and user-defined fields or Project custom fields, with a task count per value
  • Rebuild TimeLiner writes the schedule into TimeLiner with summaries, planned dates and selection sets attached, as one Navisworks undo
  • Imported tasks are tied to the selection set that has the task's name or code, so an existing set structure links the programme to the model without attaching sets by hand

How it works

Three steps inside Navisworks.

  1. 01

    Open a schedule

    Import a Primavera P6 XER or Microsoft Project XML file, or click From timeline to show the schedule Generate Timeline built.

  2. 02

    Review it against the model

    Select the critical or near critical tasks, colour the model by level or trade, and group or filter the rows by activity codes.

  3. 03

    Send it on

    Rebuild TimeLiner for the 4D simulation, or save the schedule as XER, Project XML or a schedule file.

4D coordination without leaving Navisworks

TimeLiner shows the dates of a schedule, not the logic behind them. The Schedule pane shows the relations and the critical path next to the model, so a coordinator can see which elements drive the finish date, check that the sequence in the model matches the programme, and see what moves when a duration changes.

Hiding the pane takes its colours off the model and showing it paints them again. The colours are the Group Elements palette, so a colouring by the schedule and one by a grouping replace each other cleanly.

Round trip with Primavera P6 and Microsoft Project

A planner's XER or Project XML file opens in the pane with its activity codes and custom fields. An XER that holds several projects opens on the one the file marks as exported. After review, Save writes an XER or Project XML file back, with notes on anything the format cannot hold exactly, such as relations of summary tasks. The schedule file keeps everything.

The XER and XML files the pane writes have been checked with independent readers. If a file does not open in P6 or Project as expected, the support address on this site reaches the developer.

From generated timeline to reviewed schedule

Generate Timeline builds a schedule from selection sets, with relations and a critical path. The Schedule pane picks it up at once, so the generated sequence can be reviewed against the model, adjusted, written to TimeLiner for the simulation or exported to P6 for the planner.

In Navisworks

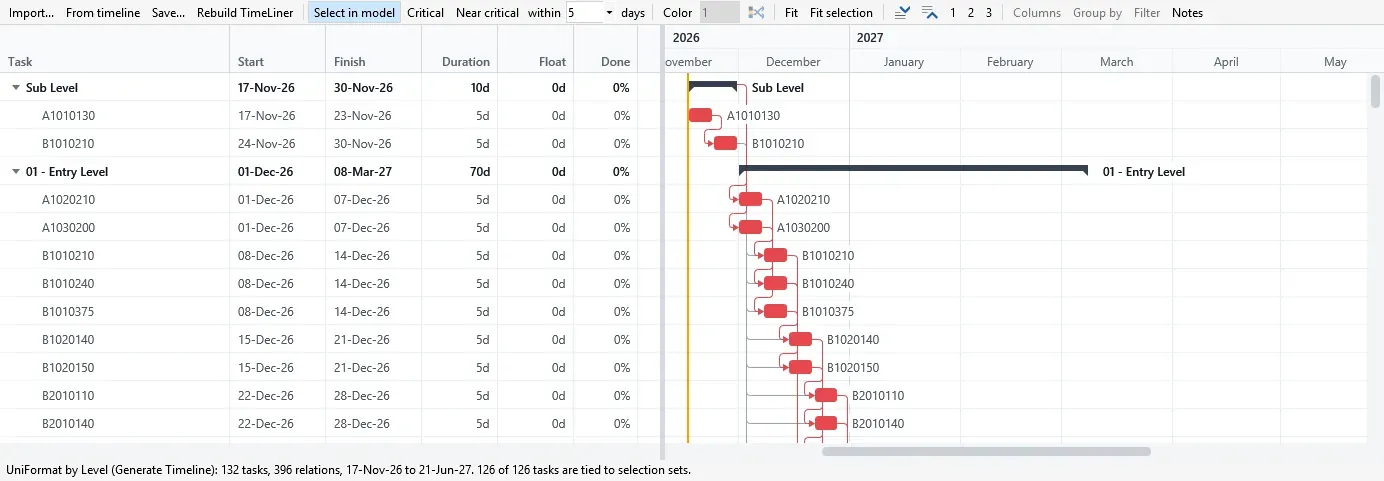
  • Schedule pane with 132 tasks and 396 relations, the grid showing start, finish, duration, float and done, and the Gantt chart beside it
    Task grid, bars, relations and float, with a status line that counts the tasks tied to selection sets.
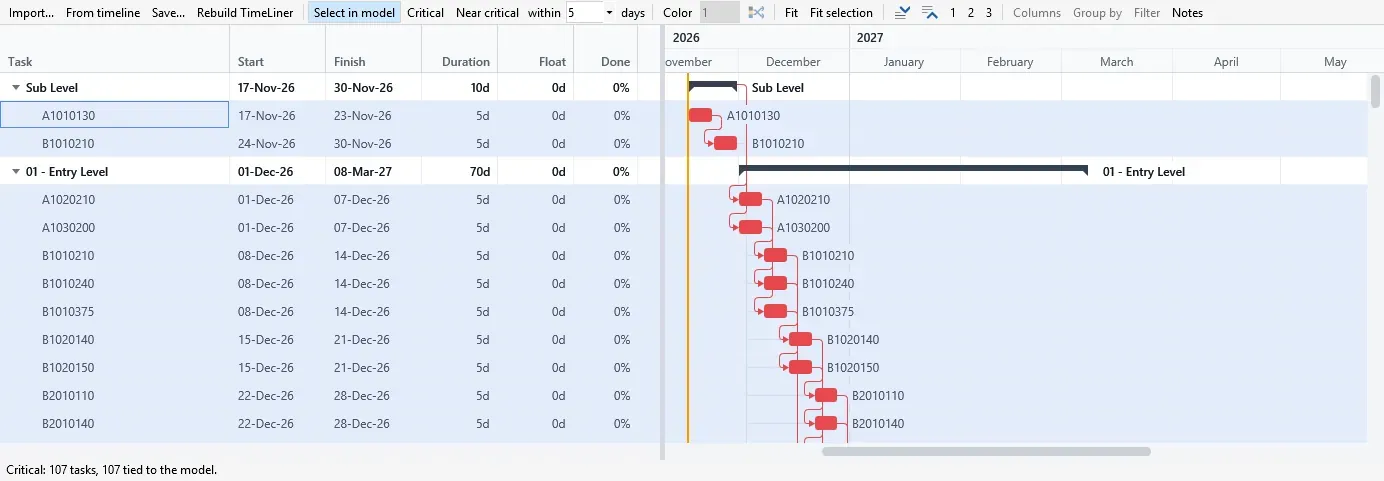
  • Schedule pane after Critical: the 107 critical tasks selected in the chart and their elements selected in the model
    Critical selects the tasks with no float, in the chart and in the model.
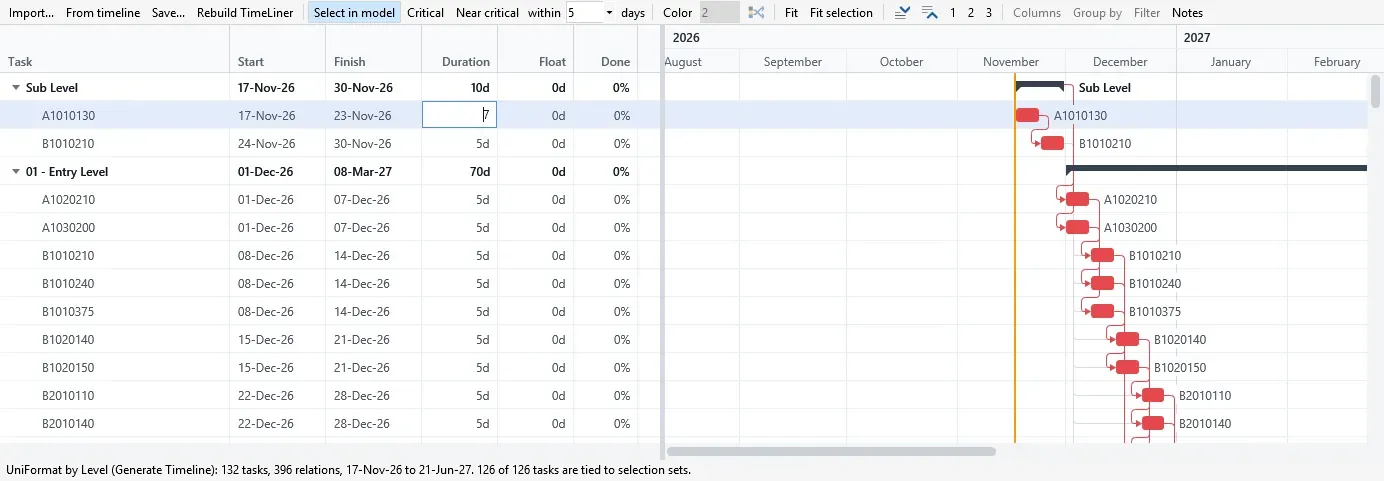
  • Duration cell of a task open for typing in the Schedule pane, with 7 typed in place of 5
    Type in a cell or drag a bar. The schedule recalculates and Ctrl+Z undoes.
  • Imported schedule grouped by the Trade activity code, with a band per trade, its task count and its dates
    Group and filter by P6 activity codes or Project custom fields.

At a glance

Where it lives and what it needs.

Ribbon panel
Schedule
Commands
Schedule
Editions
Navisworks Manage and Navisworks Simulate
Navisworks releases
2021 to 2027
Availability
On the App Store, version 3.5.0

Pressing F1 on any of these ribbon buttons opens the help page for that command on this site, which forwards to the section of the user guide that documents it.

Try it on your next coordination run.

30 days, unrestricted. Download it from the Autodesk App Store and run the installer; no administrator rights needed.