Schedule and Timeline
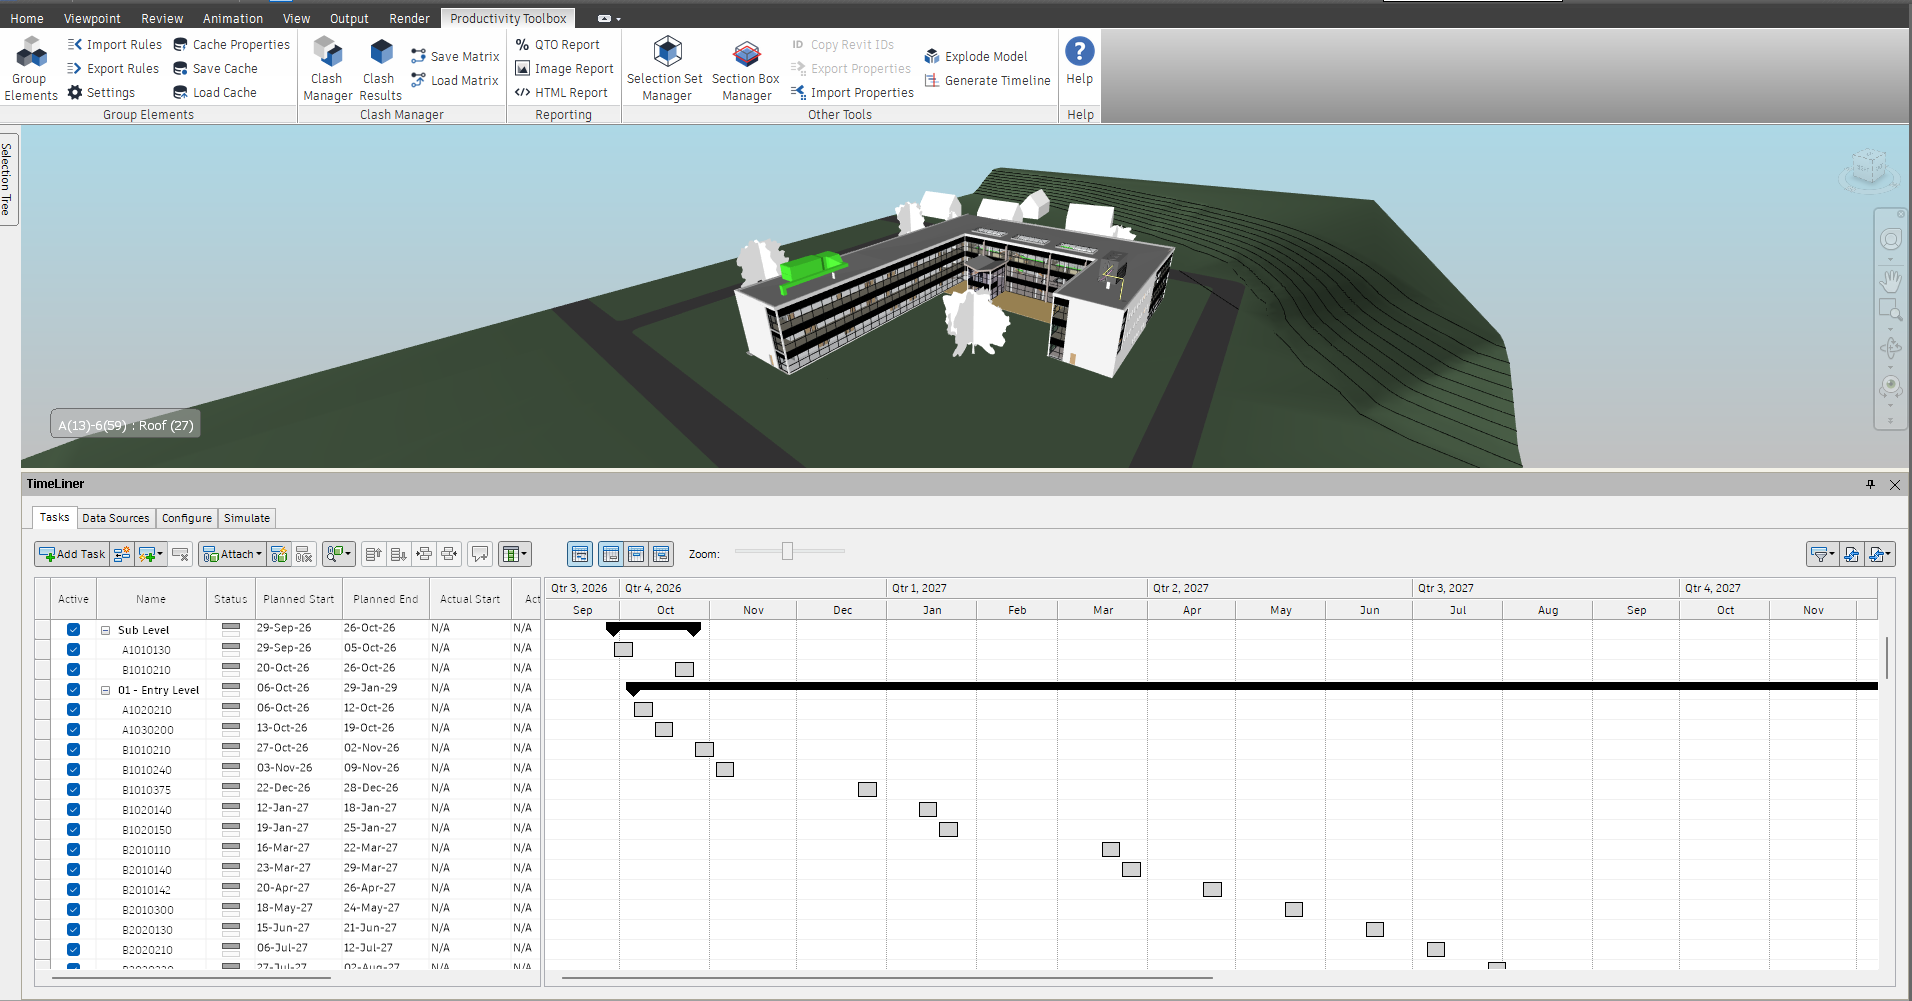
Generate Timeline turns a selection set folder into a 4D TimeLiner schedule with relations and a critical path; the Schedule pane shows it, or a Primavera P6 or Microsoft Project schedule, as a Gantt chart.
The Schedule panel, after Other Tools on the ribbon tab, holds two commands for 4D planning. Generate Timeline builds a TimeLiner schedule from a selection set folder, in construction order, and Schedule opens a pane that shows that schedule, or one you import from Primavera P6 or Microsoft Project, as a Gantt chart.
The buttons are enabled when they have something to work on:
| Button | Needs |
|---|---|
| Generate Timeline | At least one selection or search set |
| Schedule | Nothing: the pane always opens (its own buttons wait for a schedule, a timeline you generated, an open model or TimeLiner) |
Generate Timeline
Generate Timeline is on the Schedule panel of the ribbon tab. It builds a TimeLiner task tree from a selection set folder: every folder becomes a summary task and every set becomes a task attached to that set, so the simulation follows the sets even when their contents change later. A sequence blueprint decides the order in which the tasks are built, and the planned dates are laid out from a start date. It needs at least one selection or search set.
The natural input is a folder exported from Group Elements (for example a grouping by level and UniFormat code saved as selection sets), but any folder structure works.
The Generate Timeline dialog at a glance
The dialog takes you through four steps, Scope, Blueprint, Dates and Review, shown as a row of titles across the top. The step you are on is highlighted. Under the title of a step you have left, a line summarises your choice there (“UniFormat by Level · 126 sets”, the blueprint’s name, “from 17-Nov-26”, with “ · 5 d per task” added for a blueprint without relations). Click the title of a step you have already been to and you are back on it; your choices on the steps after it are kept. Back and Next at the bottom right do the same one step at a time, and Next is labelled with the step it leads to (“Next: Blueprint”). On the last step Next becomes Generate. Cancel closes the dialog and changes nothing.
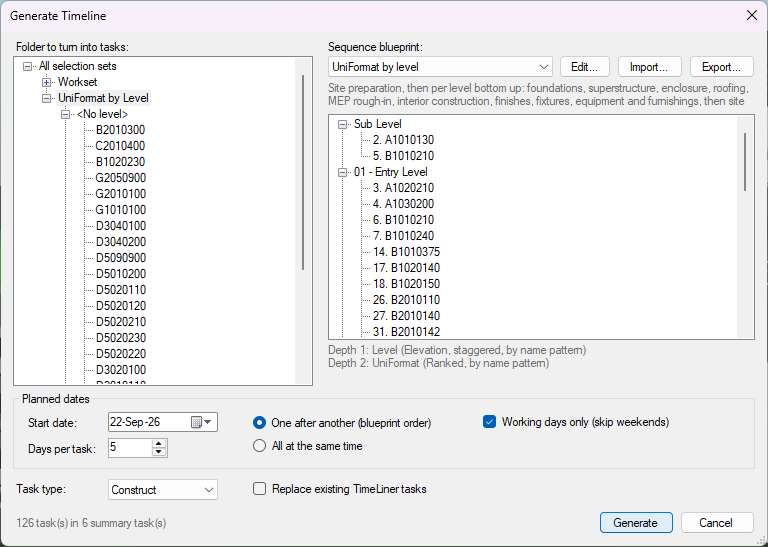
Scope (“What should become tasks?”)
- The tree on the left is the model’s selection set tree, with All selection sets at the
top. Highlight the folder (or a single set) to convert, “UniFormat by Level” in the picture;
under it sit one folder per level (
<No level>, “Sub Level”, “01 - Entry Level” and so on) and, in each, one set per UniFormat code. - What is in it on the right says what the highlighted folder holds: tiles for the number of Sets and Folders and for Levels deep (how many folder levels are nested in it, which a blueprint turns into dimensions), then a card for each depth (“Depth 1 · 6 folders”) with the names found there as small labels, the first eight and “+ N more”.
- Next: Blueprint is available once the chosen folder holds at least one set. Where it holds none, a note beside the buttons says “The chosen folder holds no selection or search sets.”
Blueprint (“How does the building go together?”)
- The blueprints are listed as cards, the built-in ones first, then your own saved ones, then
the ones you imported from files. Click a card to choose it (a double-click chooses it and
goes on to the next step); the chosen card has a blue border. UniFormat by level, with
relations is chosen when the dialog opens. A card shows:
- the blueprint’s name and a label that says where it comes from: Built-in, Yours (a blueprint you saved) or Imported (read from a file);
- Relations and critical path, when the blueprint ties its tasks to one another, so that the dates come from relations and the review shows which tasks decide the finish;
- Best fit, on the blueprint that finds the most of its dimensions in the chosen folder (the first of them when several find as many; none when no blueprint finds any);
- its description, and one label for each of its dimensions: in green “Level → depth 1 (6 values)” where the dimension finds its folder level in the chosen folder, in grey “UniFormat: not found here” where it finds nothing.
- Four blueprints are built in:
- UniFormat by level, with relations: the order of UniFormat by level, as a schedule: each kind of work moves up a level when it is done on the level below, and on a level the steps follow one another, with the services roughed in side by side. Work on different levels overlaps, so the building takes far less time than tasks in single file.
- UniFormat by level: site preparation first, then per level from the bottom up: foundations, superstructure, enclosure, roofing, MEP rough-in, interior construction, finishes, fixtures, equipment and furnishings, then site improvements. The levels are staggered so the structure of every level is done before the fit-out of any level starts. Rooms, masses, topography, rebar, grids, levels, views and similar are marked as not built.
- Revit categories by level: for models without assembly codes; per level from the bottom up, Revit categories in trade order (foundations, structure, exterior walls, roofs, MEP, partitions, finishes, fixtures, furniture).
- Folder order: no reordering; tasks follow the tree exactly as it is.
- New… opens the blueprint editor on a blank blueprint, Edit… on the chosen one (see
“Editing a blueprint” below). Import… loads a blueprint from a
.jsonfile into the list and chooses it; Export… writes the chosen blueprint to a.jsonfile to share it. - Resulting order on the right shows the task tree the chosen blueprint makes of the chosen folder, in build order. Each set carries its position in the sequence (“1. “, “2. “, …); folders and sets marked as not built are greyed and suffixed “(not built)”. The numbers jump from folder to folder when a dimension is staggered, as in the picture, where “Sub Level” holds tasks 2 and 5 and “01 - Entry Level” tasks 3, 4, 6, 7, 14 and so on.
- The text under the tree gives the count (“126 task(s) in 6 summary task(s)”, followed by “, K not built” when the blueprint excludes some of them) and says how each depth of the folder was understood, for example “Depth 1: Level (Elevation, staggered, by name pattern)” and “Depth 2: UniFormat (Ranked, by name pattern)”, or “Depth 3: not matched, folder order kept” when no dimension recognises a depth.
Dates (“When does it start, and how long does a task take?”)
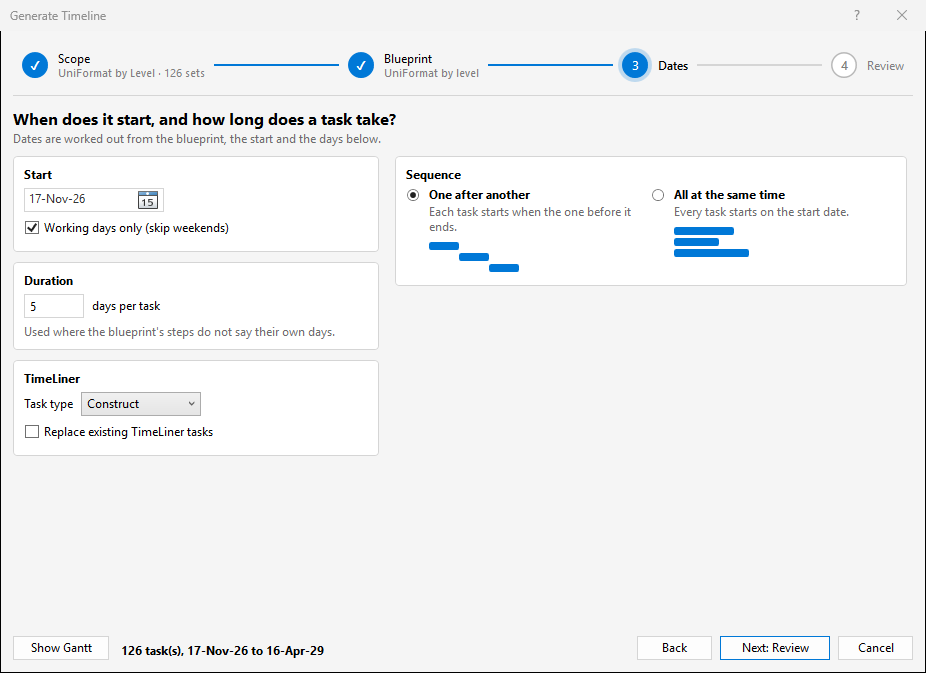
- Start: the date picker is the day the first task starts; it opens on today’s date. Working days only (skip weekends) is ticked by default; Saturdays and Sundays are skipped when counting days, and a start date on a weekend moves to the Monday.
- Duration: days per task, the duration of every task, 1 to 365 days (default 5). It is used where the blueprint’s steps do not say their own days; where a step gives its tasks days, those tasks take them instead.
- TimeLiner: Task type is Construct, Demolish or Temporary, applied to every task; Construct when the dialog opens. Replace existing TimeLiner tasks is unticked by default. When ticked, every task already in TimeLiner is deleted before the new tree is added; when unticked, the new tree is added after the existing tasks.
- Sequence: two cards.
- One after another: each task starts when the one before it ends, in the order the resulting order shows.
- All at the same time: every task starts on the start date and runs for its own days.
- Both are greyed out where a flow of the blueprint ties the chosen folder, as UniFormat by level, with relations does for a folder grouped by level, and a note says so: the flow says how the tasks follow each other (see “How a blueprint ties the tasks” below). For a folder none of the blueprint’s flows recognises, the two choices apply as for any other blueprint.
Review (“This is what will be generated”)
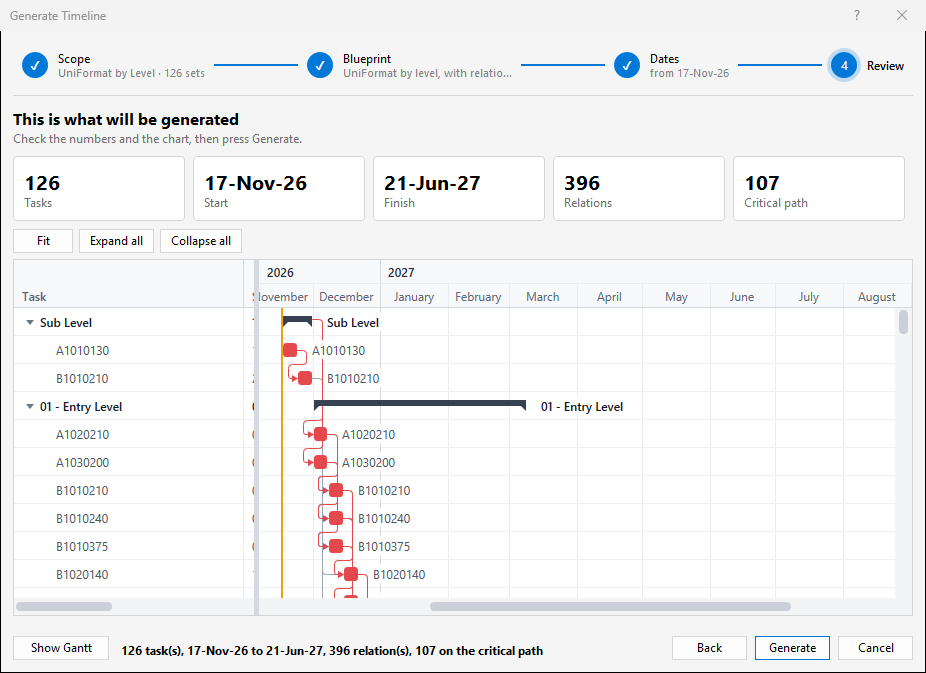
- A row of tiles gives the figures of the result: Tasks (how many tasks Generate makes in TimeLiner), Start, Finish, Relations (how many relations tie one task to another; a dash when the blueprint has none and the tasks follow the sequence you chose) and Critical path (how many tasks have no room to slip, so that a late one makes the finish late; a dash when there is none to show). Click Tasks to go back to the Scope step, or Start or Finish to go back to the Dates step.
- A yellow note above the chart lists what you should know before generating: relations left out, links that tie nothing, tasks whose quantity measured nothing, or why nothing can be generated yet. Where it says nothing can be generated, Generate stays greyed out.
- The Gantt chart shows the schedule that will be generated, one row for every summary task and task. Fit zooms it to show the whole schedule, Expand all opens every folder and Collapse all closes them.
- The Review step also reads from the model the quantities that your blueprint’s steps take their days from, as Generate does, so on a large model it takes a moment to appear; the earlier steps give such steps their plain days.
- Generate creates the tasks and reports “N task(s) in M summary task(s) created, <start> to <finish>.” with a note on tasks that are disabled because the blueprint marks them as not built. For a blueprint with flows it also says “K of the N task(s) that are built are on the critical path: a delay there delays the finish.”, when some tasks are critical and others are not.
Show Gantt and the bottom row
- From the Blueprint step on, the line beside Show Gantt at the bottom left says what your choices come to: the number of tasks, the start and finish, and, where they apply, the relations, the tasks on the critical path and how many are not built. It follows every change you make.
- Show Gantt opens the same chart in a window of its own, titled “Gantt: “ and the blueprint’s name. The window stays open beside the dialog, on another screen if you like, and redraws after every change you make in the dialog, so you see the schedule move while you work. Clicking Show Gantt again brings the window to the front. It keeps the size you gave it for the next time.
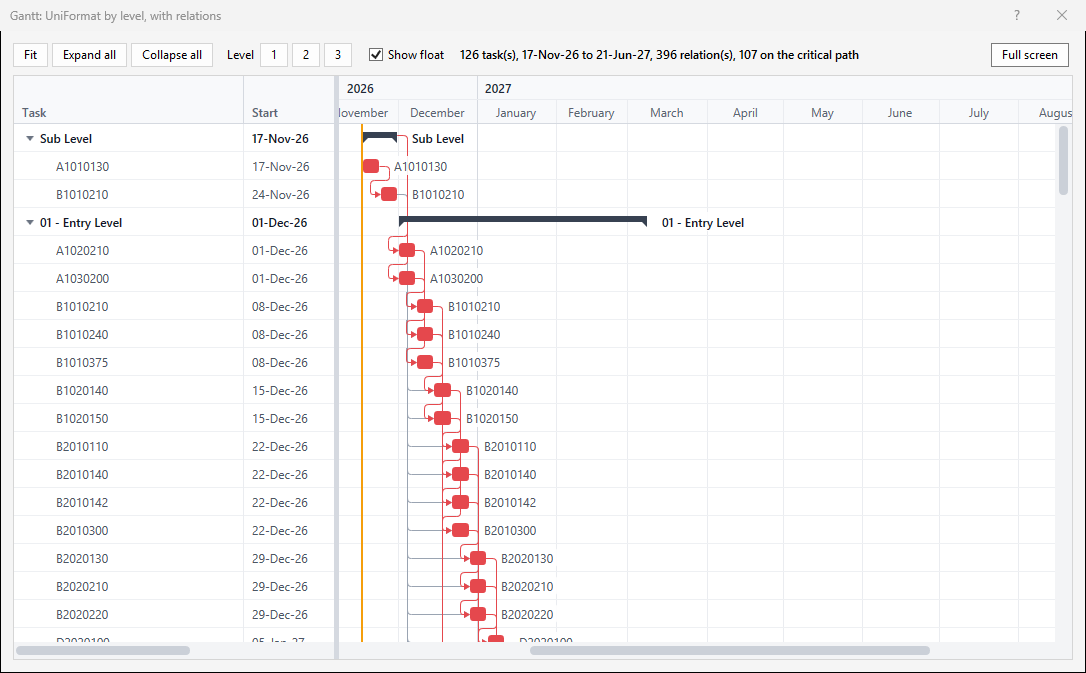
- The bar at the top of the window has Fit, Expand all and Collapse all as in the review, Level 1, 2 and 3 (the buttons “1”, “2” and “3” after the word Level), which show the chart down to that depth of folders only, Show float and Full screen. Show float draws after each bar how far the task can slip without moving the finish; a task without float is on the critical path. Full screen makes the window fill the screen and then reads Exit full screen; F11 does the same. The summary of the schedule is on the bar too, and a yellow note under it lists what you should know, as on the Review step.
What the tasks look like
- One summary task per folder, named after the folder; its dates span its children.
- One task per set, named after the set, with the set attached as its selection. Its Display ID is the task’s position in the build sequence.
- Every task runs from 08:00 on its first day to 17:00 on its last day.
- Tasks for names on the blueprint’s not-built list are created but disabled, so they do not animate, and take the dates of their built siblings.
Generating a timeline from an exported grouping
- In Group Elements, create a grouping by Level and UniFormat (assembly code) and save it to selection sets; a folder named after the grouping, “UniFormat by Level”, appears in the selection set tree, with one sub-folder per level and one set per code.
- Click Generate Timeline.
- On the Scope step, highlight that folder in the tree. What is in it should show two depths, the levels and then the UniFormat codes. Click Next: Blueprint.
- On the Blueprint step, click the card UniFormat by level. Check its labels: it should read “Level → depth 1” and “UniFormat → depth 2”, and the text under Resulting order should read “Depth 1: Level (Elevation, staggered, by name pattern)” and “Depth 2: UniFormat (Ranked, by name pattern)”.
- Look through Resulting order and confirm that the order makes sense: foundations before structure, structure of the lower level before the upper one, finishes last. Click Next: Dates.
- On the Dates step, set the start date and days per task, 5 days in the picture, and keep One after another and Working days only (skip weekends).
- Leave Task type on Construct, or choose another one, and tick Replace existing TimeLiner tasks if the TimeLiner should hold only this schedule. Click Next: Review.
- On the Review step, read the tiles and the chart. Click Show Gantt if you want the chart in a window of its own. Click Generate and read the confirmation.
- Open the Navisworks TimeLiner window and its Tasks tab: the task tree is there, with the sets attached. Adjust durations and dates in TimeLiner as needed and run the simulation.
How a blueprint orders the tree
A blueprint is a list of dimensions, one per level of the breakdown (Level, UniFormat, Category, …). Each dimension has:
- Recognisers that tell it which depth of the folder it applies to. A
propertyrecogniser matches the name of the grouping rule that produced the folder (Group Elements writes it into the folder name, “Level/Element/UniFormat/Category”); aregexrecogniser matches when most folder names at a depth fit a pattern; alistrecogniser matches when most names are on a fixed list. Depths that no dimension recognises keep their folder order. When the exported folder carries the grouping’s own name rather than the rule path, as “UniFormat by Level” does, theregexandlistrecognisers do the work, and the bindings text says “by name pattern” instead of “by grouping rule”. - A Sort: AsIs (folder order), Natural (alphabetical with numbers compared as numbers), Elevation (by the height of the elements, lowest first) or Ranked (by the position of the name in the dimension’s order of steps).
- An order of steps for the Ranked sort, one pattern or more for each step: patterns such as
B1010*orWalls, in build order.*is a wildcard, matching ignores case, and when several patterns match a name the most specific one wins. - Unmatched go:: where names that match no rank pattern go: Last, First or Exclude (the task is still created but disabled).
- Staggered: work the dimension’s values in parallel: the sequence walks the next dimension first, so with Level staggered the structure of every level comes before the enclosure of any level.
On top of the dimensions, the blueprint’s Not built list names folders or sets (wildcards allowed) that are never built; their tasks are created disabled and take their parent’s dates.
How a blueprint ties the tasks
A blueprint can also say how the tasks follow each other in time, which gives a schedule with overlapping work and a critical path instead of tasks in single file. Two things say it per dimension, steps and a flow, and a third, links, says the exceptions:
-
Steps: the rank order written as steps. A step holds one or more patterns, and the values they match are worked together. A value no pattern matches is a step of its own, where Unmatched go: puts it. A step can give its tasks their days, above 0 and up to 3650; they apply to every set below a value of the step, unless a step nearer to the set says otherwise, and whether or not a flow ties the tasks. A dimension with steps is sorted by them: its Sort is Ranked. In a dimension sorted by Elevation, values of the same height are one step, so two wings of a level are worked together.
-
A Flow: how one step of the dimension leads to the next.
- Together: the steps are not tied; they run at the same time.
- In turn: everything in a step is done before anything in the next one starts.
- Like for like: each task follows the same task in the step before: the structure of a level follows the structure of the level below. Where the step before has no such task it follows the nearest one that has. A task that is the first of its kind, such as the roofing on the top level, follows what the task before it in its own folder follows: with the roofing ranked after the structure, that is the structure of the level below, so the roofing does not wait for the finishes below. Where no task before it in its folder has one, it follows what its folder follows by the same rule (a new zone of a level goes where the zone before it goes), and only then everything in the step before. So where a new kind of work stands in the rank order says what it waits for.
A flow has a relation, finish-to-start unless it says otherwise, and a lag in working days, which can be negative for an overlap and need not be whole; a day is the nine hours from 08:00 to 17:00. Like for like with start-to-start and a lag of 5 days starts each level five days after the one below. Keep finish-to-finish and start-to-finish for the innermost dimension: between folders such a relation has nothing to hold, is left out, and the confirmation says how many were.
A flow or a link ties only the folder its dimension recognises. For a flow the bindings text under Resulting order shows it, “Depth 1: Level (Elevation, like for like, by name pattern)”. Where no flow and no link of the blueprint binds to the chosen folder, the two sequence choices on the Dates step say how the tasks follow each other; where one does, the blueprint says it, the two choices are greyed out, and Staggered has no say in the dates.
UniFormat by level, with relations uses like for like on Level, in turn on UniFormat with the services as one step, and in turn on Category, which is what orders the work of a level in a folder grouped by level and category, without UniFormat codes.
Steps and flows are made on the editor’s board (see below): each box is a step, and Steps follow is the flow. In the blueprint’s file, which you can export, the same reads:
{
  "Property": "UniFormat",
  "Sort": "Ranked",
  "Flow": { "Mode": "InTurn", "Type": "FinishToStart", "LagDays": 0 },
  "Steps": [
    { "Match": [ "B10*" ], "Days": 10 },
    { "Match": [ "D20*", "D30*", "D50*" ], "Days": 6 },
    { "Match": [ "C30*" ] }
  ]
}
Mode is Together, InTurn or LikeForLike; Type is FinishToStart, StartToStart,
FinishToFinish or StartToFinish. A dimension with steps needs no rank list of its own: the
editor writes one from the steps, which is what an older version of the toolbox reads.
Days from quantities
A step can work out the days of its tasks from the model in place of saying them. It names a quantity, a property of the model that is summed over the elements of each set, and what a working day puts out of it:
{ "Match": [ "B10*" ], "Days": 10,
"Quantity": { "Category": "Element", "Property": "Volume", "Unit": "Meters" }, "PerDay": 40 }- Each set below a value of the step takes its own total divided by
PerDay, in whole days rounded up, and one day at least: 130 cubic metres at 40 a day are 4 days. CategoryandPropertyare the names the model shows, letter for letter, as in a classification’s quantities, and the same values count as there and in the QTO report: one stored as a decimal number, with or without a unit. “150 mm” as text does not count, nor does a whole number the model stores as an integer, and an element without the property adds nothing.Unitis a unit of length as Navisworks names it (Meters,Feet,Millimeters…): a length is summed in it, an area in its square, a volume in its cube. Left out, the total is in the model’s units, which for a model in millimetres makes a volume a very large number: name the unit thatPerDayis meant in. A decimal number without a unit is taken as it is."Quantity": {}counts the elements of the set, so"PerDay": 25says 25 elements a day.- The elements of a set are the ones Group Elements works on: what the set’s search finds or what it holds, with everything below that, less files, layers and groups. An element that is in two sets counts in both. Sets that are not built are not measured.
- A set with nothing to measure (no element has the property, or the total is nothing) takes
the days it would take without a quantity: the step’s
Days, or else those of a step above it, or else Days per task of the Generate Timeline dialog. So does a set whose total would come to more than 3650 days, which is the sign of a unit that does not fitPerDay. The dialog’s summary after Generate says how many tasks took their days from a quantity, how many had nothing to measure and how many would have taken too long. - As with
Days, the nearest step above a set counts. A step that says onlyDaystakes its sets out of a quantity named by a step above it.
The quantities are read from the model when the timeline is generated, each element of each set once for each quantity, which on a large model takes seconds, and longer where the sets are searches that have to be run first. A quantity is chosen in the editor’s Selection tab for a selected step, with Days from: and A day puts out: (see below), or written in the blueprint’s file. The step’s box on the board shows it and the editor keeps it with the step when the step is moved or its patterns are split off; a step that is joined to the one before it takes that step’s days and quantity.
Links: the exceptions
A flow ties each step of a dimension to the ones before it by one rule. What that cannot say is a link: of the values of one dimension, those its To pattern matches follow those its From pattern matches, with a relation and a lag in working days like a flow’s (finish-to-start and none unless it says otherwise). Patterns are wildcards, whatever the letter case. Where the other end is found is the rest of the link:
- Nothing more said: in the same place, below the same folder.
From“B10*” andTo“C*” on UniFormat make the finishes of each level wait for that level’s structure. Alonga dimension above, with anOffset: that many steps along it, counted from the value that follows. Above nothing is later in the dimension’s order (up, for levels sorted by elevation), below it earlier."Along": "Level", "Offset": 2on a link from the structure to the enclosure says “the enclosure waits for the structure two floors up”. The top two levels have no level two up and get no relation from it.Alonga dimension above, without an offset: anywhere along it."Along": "Level"on a link from the roofing to the finishes says “the finishes of every level wait for the roof”."Along": "*": everywhere, whatever the folders above.
Where there are folders between the two dimensions, such as zones on each level, a link along the levels stays in the zone of the same name: the finishes of the east zone wait for the roofing of the east zone.
A link ties whatever is at the depth its dimension binds to, folders as well as sets, so a link on Level from “L1” to “L2” makes the whole second level wait for the first. A few things are left out, and the confirmation says how many:
- A relation that would make tasks wait for each other in a loop. The usual cause is a flow that already says the opposite: if the roofing is not in the rank order it comes last on its level and, like for like, follows the finishes of the level below, which then cannot wait for it. Rank the roofing where it belongs, after the structure.
- A finish-to-finish or start-to-finish link between folders, which holds nothing, as with a flow.
- A link that names more than 2000 pairs of values, which is a mistake in its patterns.
The confirmation also says how many links tie nothing in the chosen folder because no values match their patterns where they look: the usual cause is a pattern with a typing mistake.
Where a flow already ties two values the same way, the link’s lag takes the place of the flow’s: in turn with a link from the structure to the enclosure that says three days, the enclosure starts three days after the structure is done. Of two links on the same two values, the later one counts.
A link whose dimension the chosen folder does not have ties nothing there and leaves the dialog its two choices, and so does one that reaches along a dimension the folder does not have above the link’s own. A link looks at the depth its dimension binds to, so a set that sits one folder higher than the others of its kind is not found, and steps along a dimension are counted over the folders in which something is built.
In the editor a link goes with its dimension: renaming a dimension’s Property renames it in the links, and removing a dimension removes the links that are of it or reach along it.
Links are made on the editor’s Exceptions tab (see below). In the blueprint’s file they are
Links beside Dimensions:
"Links": [
  { "Dimension": "UniFormat", "From": "B30*", "To": "C*", "Along": "Level" },
  { "Dimension": "UniFormat", "From": "B10*", "To": "B20*", "Type": "StartToStart", "LagDays": 5, "Along": "Level", "Offset": 2 }
]
Dimension and Along are the Property of a dimension of the blueprint, and not the
catch-all *; Type and LagDays are as for a flow and can be left out.
Editing a blueprint
The editor opens from Edit… on the Blueprint step, on the chosen blueprint, or from New…, on a blank blueprint with one dimension. It checks every change live against the folder chosen on the Scope step, so you see immediately which depth each dimension binds to, how many values every pattern catches and what the schedule comes to. It is a flow board: the steps of one dimension are boxes in the order of work, joined by arrows that say how one step leads to the next.
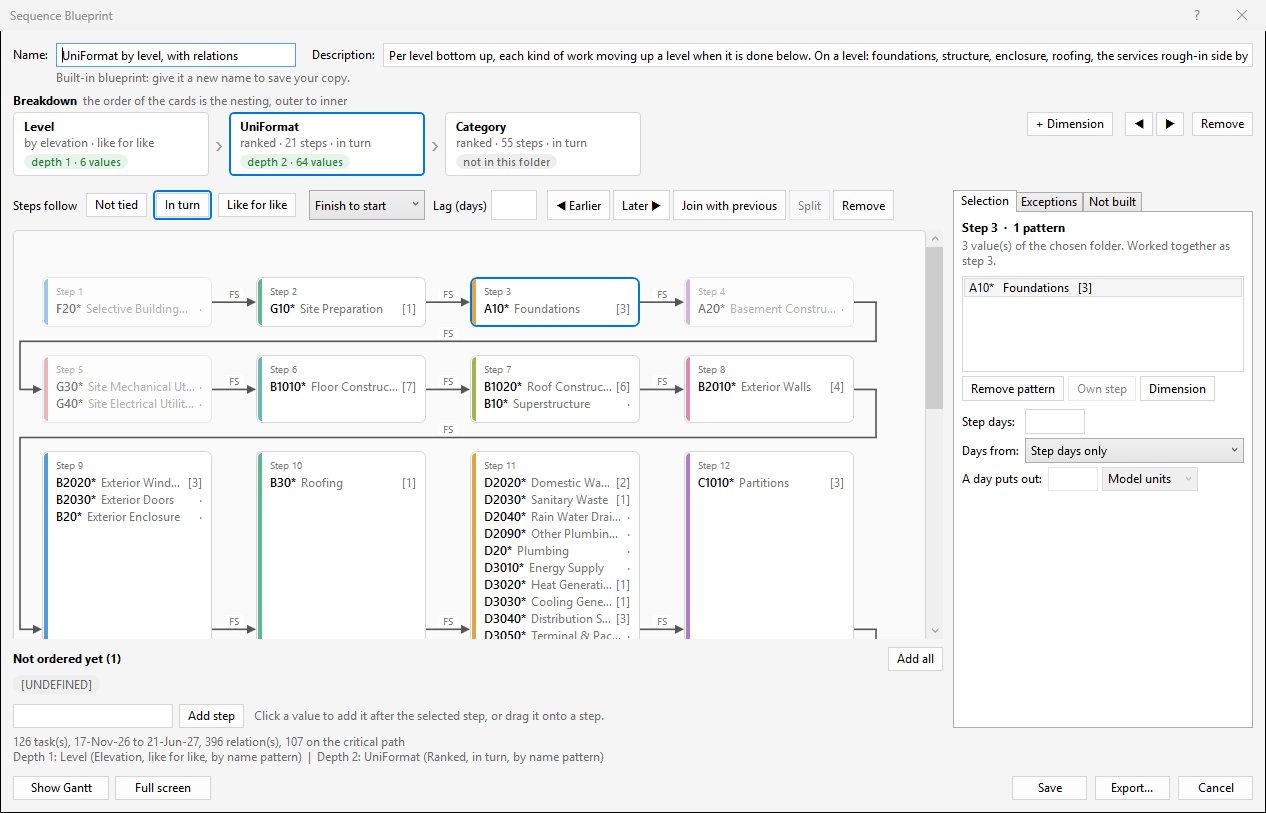
The header and the Breakdown
- Name: and Description: are at the top. The description is shown under the name on the blueprint’s card. A built-in blueprint shows the note “Built-in blueprint: give it a new name to save your copy.” and cannot be overwritten.
- The Breakdown strip lists the blueprint’s dimensions as cards, outer to inner: the order of the cards is the nesting of the folders, a dimension for each level of the breakdown. A card shows the dimension’s name (its Label, else its Property), a line such as “ranked · 21 steps · in turn” or “by elevation · like for like”, and a label that says where the dimension finds its folder level: “depth 2 · 38 values”, or “not in this folder” in grey. Click a card to work on that dimension.
- + Dimension appends a new dimension, selects it and puts the cursor in its Property: box. The two arrow buttons beside it move the selected dimension one place outwards or inwards in the nesting, and Remove deletes the selected one (the last dimension cannot be removed).
The board and its flow
- The board shows the steps of the selected dimension. A box is a step: its number, its days (such as “10 d”, or, for a step that takes its days from a quantity, the quantity and what a day puts out), and one line for each of its patterns with the title of the code (for UniFormat, “B2010* Exterior Walls”) and in brackets how many values of the chosen folder it catches (a dot when it catches none; a step that catches nothing is faded). A yellow label in a box, “waits for … (elsewhere)”, says an exception link of the Exceptions tab makes the step wait for values somewhere else. The boxes wrap onto new rows where the board is narrower than they are, and the board scrolls.
- The board can be worked on only for a dimension whose Sort is Ranked. For another sort it shows the values found in the chosen folder in the order the sort gives them, as read-only boxes, with a note to choose Sort: Ranked in the Selection tab to set your own order of work.
- Steps follow is the dimension’s flow, three buttons of which the chosen one is highlighted: Not tied, In turn and Like for like (what they mean is under “How a blueprint ties the tasks” above). Beside them, a drop-down holds the relation (Finish to start, Start to start, Finish to finish, Start to finish) and Lag (days) is in working days, negative for an overlap; both are greyed out while the steps are not tied. A lag that is no number between -3650 and 3650 turns red and is not taken. Not tied means this dimension ties nothing: where another dimension of the blueprint ties the chosen folder its values run at the same time, and where none does the dialog’s two sequence choices decide, as in a blueprint without relations. While the steps are tied, Staggered (Selection tab) is greyed out.
- Where the steps are tied, an arrow joins each box to the next, and a small label on it says the relation: “FS” for finish to start, and for another relation or a lag “SS + 2 d” (start to start with a lag of two days), “FF”, “SF”.
Steps
Click a box to select it. The step buttons above the board then work on it, and the Selection tab of the inspector shows it.
- Earlier and Later move the step one place along the order of work. You can also drag a box to another place on the board.
- Join with previous puts the patterns of the step into the step before it, so their values are worked together and the next step follows all of them. What joins takes the days of the step it joins. It is not available for the first step.
- Split gives every pattern of a step its own step again, one after another. It is available for a step with more than one pattern.
- Remove takes the step out of the order; its values are then listed under Not ordered yet.
- A dimension gets steps the first time you join patterns, or give a step days or a quantity. From then on a step’s values are worked together, also several values that one pattern catches: under “A10*” the folders A1010 and A1020 run at the same time, where in a plain rank each value is a step of its own and they follow each other. No steps (Selection tab, with nothing selected on the board) makes the dimension a plain rank again: the patterns keep their order, the step days and quantities are dropped.
Not ordered yet
Under the board, for a ranked dimension, are the values of the chosen folder that no step holds, as small labels (“Not ordered yet (1)”). Until you give them a step they are handled as Unmatched go: says.
- Click a value to add it as a step after the selected step (at the end when none is selected), or drag it onto a step to join that step, or onto the empty board to add it at the end.
- Add all adds every one of them as a step of its own, after the selected step.
- Or type a pattern in the box (“B20*”; several can be separated by commas or semicolons) and click Add step: each becomes a step of its own after the selected step.
One arrow’s own relation
A flow gives all the arrows of a dimension the same relation. To give one arrow another, click the label on it (“FS”). A small panel opens with the relation and the lag and three choices:
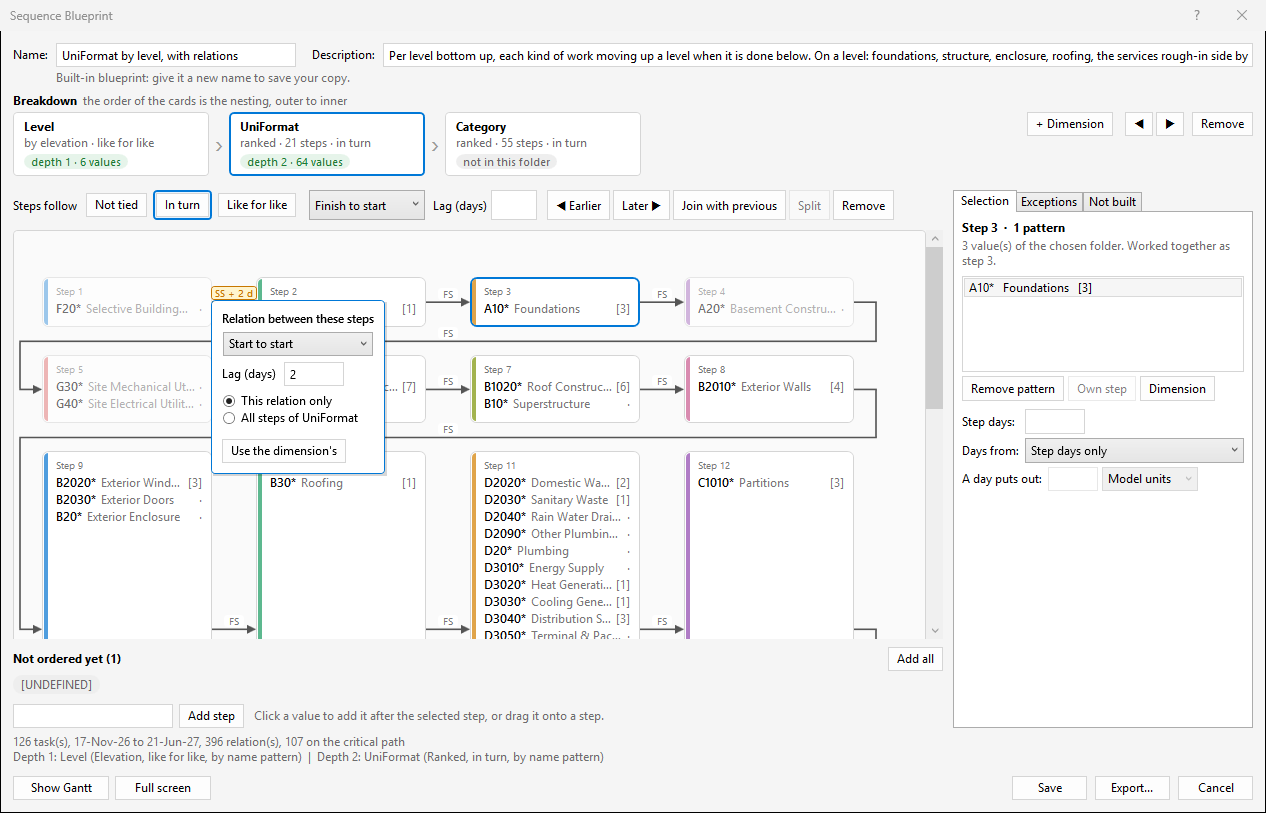
- This relation only (chosen to start with): the relation and lag you set belong to this arrow alone. When you close the panel the arrow turns amber and shows its own relation; every other arrow keeps the dimension’s. Nothing is added: the two steps are tied as before, only by another relation.
- All steps of the dimension: what you set becomes the dimension’s relation, as if you had set it beside Steps follow; every arrow without one of its own follows.
- Use the dimension’s, shown for an arrow that has its own relation, gives the arrow the dimension’s relation again and closes the panel.
An arrow’s relation is stored as a link: it shows on the Exceptions tab with “in place of the
flow’s relation” at the end of its row. For the catch-all dimension *, which has no links, only All steps of is available.
The inspector
The tabs on the right work on what is selected.
- Selection: with no step selected, the dimension; with a step selected, the step. Dimension
in the step’s view goes back to the dimension.
- The dimension: Property: is the name of the dimension, which is also what a
propertyrecogniser looks for; Label: is the display text; Sort:; Unmatched go:; Staggered (work its values in parallel); No steps. A summary line says “Bound to depth 2 by name pattern: 38 value(s), 35 ranked, 3 unmatched”, or “Not bound to any depth of the chosen folder.” - Recognisers (✓ = fires on the chosen folder): the list, with a tick in front of the
recogniser that bound the dimension, and no tick at all when none of them fires. Pick the
kind (property, regex or list) in the small drop-down, type the argument and
click Add; Del removes the selected one. The Level dimension of the built-in
blueprint carries one of each:
property:Level, aregex:for names such as “L2”, “Level 2”, “02 -”, “Roof” or “Ground”, and alist:for<No level>. - The step: its title (“Step 3 · 2 patterns”) and a note with how many values of the chosen folder it catches; the list of its patterns, with Remove pattern to take the selected pattern out of the step and Own step to take it out into a step of its own after this one (available for a step with more than one pattern).
- Step days: is how many days the tasks of the step take, above 0 and up to 3650; empty means the days of the Generate Timeline dialog, and anything else turns red and is not taken.
- Days from: is what the tasks of the step take their days from (see “Days from quantities” above): Step days only, Number of elements, or a property of the model, listed as “Element / Volume”. The model’s properties are read the first time the list is opened, which on a large model takes a moment. A quantity the blueprint names that the open model does not have, from a blueprint made for another model, is listed as well, as “Element / Volume (not in the model)”, and stays chosen until you choose another. A day puts out: is how much of the quantity is done in a working day, above 0 and up to 1,000,000,000; anything else turns red and is not taken, and an emptied box keeps the number it had. A step that is given a quantity puts out 1 a day until you type another number, and Step days only takes the quantity and the number away. The list beside the box is the unit the property is summed in: Model units, or a unit of length such as Meters or Feet. It is greyed out for Number of elements, and with the box for Step days only. The quantity is the step’s, so every pattern of the step shows the same.
- The line under them says what the step’s quantity comes to in the chosen folder: how many sets it applies to, the smallest and the largest total with the days each comes to (“Applies to 2 set(s): 13.80 m² in 1 day(s) to 17.25 m² in 1 day(s).”), and how many sets have nothing to measure and how many would take more than 3650 days. The sets are read from the model when you select a step and when you choose a quantity or a unit, not while you type what a day puts out, which only divides again. Without a folder chosen on the Scope step the line says there is nothing to measure against.
- The dimension: Property: is the name of the dimension, which is also what a
- Exceptions: the exception links, in a list with Add, Remove, Up and Down
under it, and the selected link in the boxes below. The order counts where two links tie the
same two values with the same relation: the lower one in the list says the lag.
- Dimension: the dimension the link is of; every dimension of the blueprint but the
catch-all
*. - Comes first: and Follows: the two patterns. A new link has “(comes first)” and “(follows)” in them, which match nothing until you type your own; an emptied box keeps what it had.
- Relation: and Lag (days): as for a flow. A lag that is no number between -3650 and 3650 turns red and is not taken.
- Comes first is: where the values that come first are, seen from the value that follows: In the same place, Steps along, Anywhere along or Everywhere. Along: is the dimension to go along, any but the link’s own, and is greyed out for the same place and for everywhere. Where none is chosen yet, or the one chosen becomes the link’s own, the dimension just before the link’s own in the blueprint is taken, or else the first there is. Steps: is how many steps, above 0 for later in that dimension’s order (up, for levels) and below 0 for earlier; it is used for Steps along only, starts at 1, and what is no whole number other than 0 between -1000 and 1000 turns red. An emptied box keeps the number it had.
- The line under the boxes says what the link comes to in the chosen folder: how many pairs of values it names and ties, how many are left out because they would close a loop or are tied the same way already, or that it ties nothing there and why.
- A row of the list reads like “C* follows B30* (UniFormat, anywhere along Level)”.
- Dimension: the dimension the link is of; every dimension of the blueprint but the
catch-all
- Not built: the exclusion patterns, with a box, Add and Del under the list, and a
line saying which names of the chosen folder they currently match. The built-in list names
Rooms,
<Room Separation>, Mass, Topography, Center line, Entourage, Pads, Structural Area Reinforcement, Structural Path Reinforcement, Structural Rebar, Structural Stiffeners, Structural Fabric*, Lines, Grids, Levels, Views and Cameras.
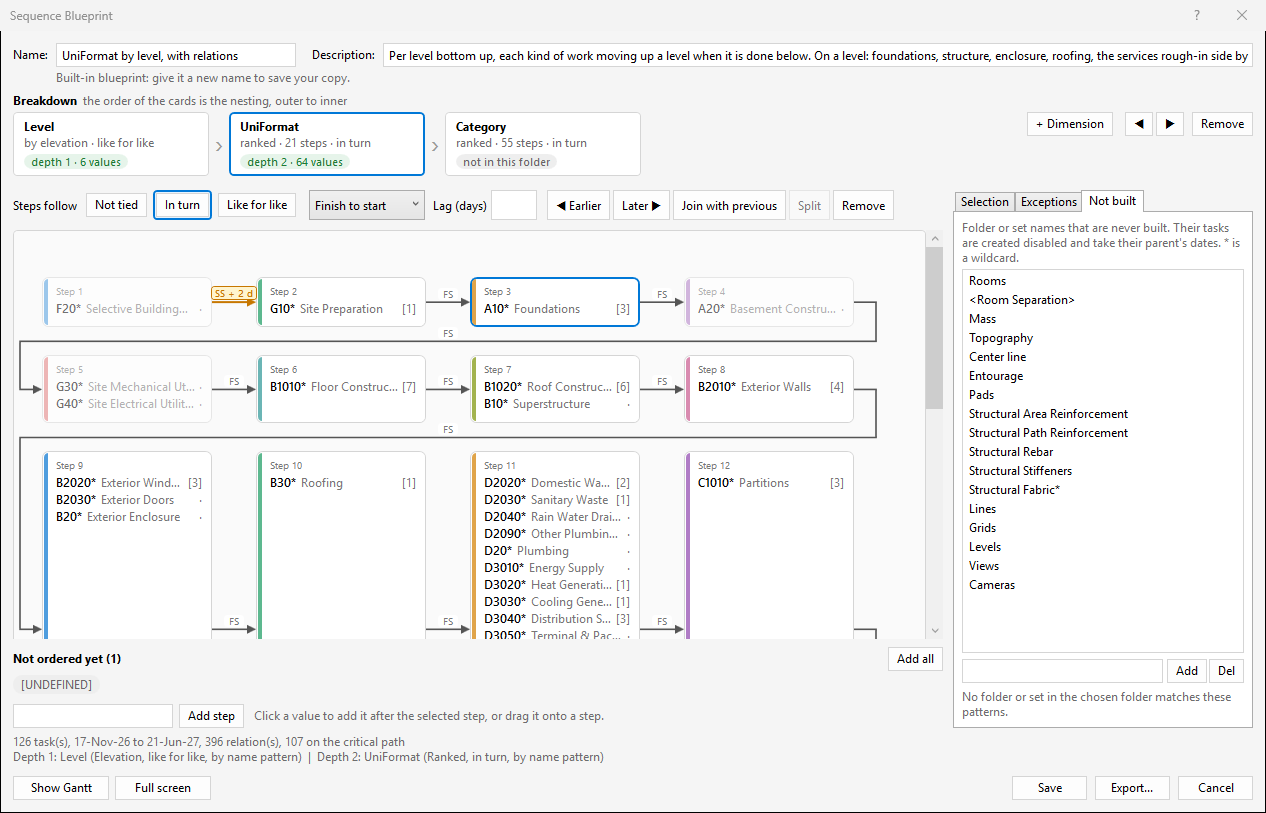
Seeing the result, and saving
- The line under the board says what the blueprint comes to on the chosen folder: “126 task(s), 17-Nov-26 to 21-Jun-27, 396 relation(s), 107 on the critical path” followed by the depth bindings separated by vertical bars. It is worked out with a start date of today, five days per task, one after another and working days only.
- Show Gantt opens the schedule the blueprint makes of the chosen folder as a chart in a window of its own, the same window as in the Generate Timeline dialog (see “The dialog at a glance”). It stays open beside the editor and redraws after every change you make to the blueprint, so you can move a box and watch the finish date move. Keep it on a second screen while you edit.
- Full screen makes the editor fill the screen, so the board gets all the room there is, and then reads Exit full screen; F11 does the same.
- Save stores the blueprint under its Name: in your user profile and selects it in the Generate Timeline dialog. A blank name is refused; a built-in name is refused (“Choose another name to save your copy.”); an existing name of your own asks whether to replace it. Renaming a stored blueprint replaces the old file.
- Export… writes the blueprint to a
.jsonfile without storing it. A blueprint is a plain text file: you can send it to a colleague, keep a copy, or open it in a text editor to change what the editor does not offer, and bring it back with Import… on the Blueprint step. - Delete: only shown for a stored blueprint; removes it after a confirmation.
- Cancel: discards the changes.
Typical edit: open UniFormat by level, select the UniFormat dimension and look at Not ordered yet. Add the codes your model uses that the order does not know, by clicking them, and drag their boxes to the right place; then give the blueprint a new name and click Save. In UniFormat by level, with relations the UniFormat dimension has steps: select the last code of the step yours belongs to, for example the last of the services, and click your code under Not ordered yet; it becomes a step of its own right after, and Join with previous puts it in that step.
Tips
- Every task gets the days per task duration unless a step of the blueprint gives its tasks their own days (see “How a blueprint ties the tasks”). Adjust individual durations in TimeLiner afterwards.
- When the bindings text on the Blueprint step says “not matched, folder order kept” for a depth
you expected to be ordered, open the editor: the Recognisers list shows which recogniser
fires, and a
regexorlistrecogniser can be added for your naming convention. - Replace existing TimeLiner tasks deletes every task in TimeLiner, including ones you made by hand or imported from a schedule. Leave it unticked to append instead.
- Choose a single set instead of a folder to create one task.
- Search sets are attached like selection sets, so a task built from a search follows the search when the model is updated.
- Hover over a control for an explanation of it; many come with a small drawing.
- Keep the Gantt window open on a second screen while you work: it follows every change you make in the dialog or the editor that opened it, so you see the finish date and the critical path move as you change a flow or a step.
- An amber arrow on the board is a relation of its own. To give it the dimension’s relation again, click its label and choose Use the dimension’s.
- Blueprints are plain files; Export… and Import… move them between machines, and a saved blueprint is listed in every model you open.
Schedule
Schedule is the large button on the Schedule panel of the ribbon tab. It toggles a dock pane that shows a schedule as a Gantt chart: a grid of tasks on the left, bars, relations, float and the critical path on the right. The schedule can be the one Generate Timeline built, or one you import from a Primavera P6 XER file or a Microsoft Project XML file. You can edit it, colour it, select its tasks in the model, write it into TimeLiner and save it for P6 or Project.
The pane is always available. Most of its buttons wait for what they need: From timeline for a timeline you generated in this session, Rebuild TimeLiner and the model buttons for an open model, and Columns, Group by and Filter for a schedule that has user fields (activity codes and custom fields). The schedule is kept in memory only: it is not stored in the model, and Navisworks forgets it when you close it, unless you use Save….
The Schedule pane at a glance
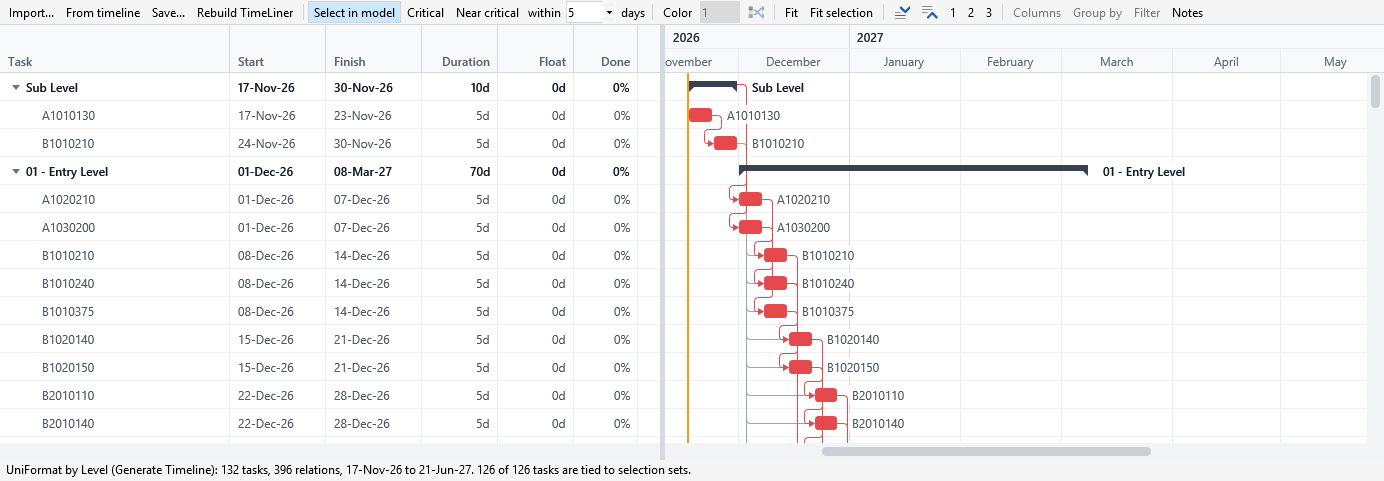
The toolbar runs along the top, the grid and the chart fill the middle, and the status line is at the bottom. The toolbar, from left to right:
- Import… opens a file dialog, Import Schedule, for a Primavera P6 XER (
.xer), a Microsoft Project XML (.xml) or a schedule saved from this pane (.json). - From timeline shows the schedule Generate Timeline built last in this session. It is greyed out until you have generated one.
- Save… writes the schedule shown to a file, Save Schedule, as a schedule file (
.json), a Primavera P6 XER or a Microsoft Project XML file. It needs a schedule on show. - Rebuild TimeLiner writes the schedule shown into TimeLiner. It needs a schedule on show and an open model with TimeLiner.
- Select in model is ticked when the pane opens. While it is ticked, selecting rows in the chart selects the elements of their selection sets in the model.
- Critical selects the critical tasks, in the chart and in the model.
- Near critical selects the tasks that are not critical but have little float, and the box after within sets how little, in days: 1, 2, 3, 5, 10, 15, 20 or 30 (5 to begin with).
- Color colours the tasks of one outline level, and the box after it chooses the level. The small icon button after the box is Shuffle colors. The box and the button wait until Color is on.
- Fit shows the whole schedule across the chart; Fit selection shows the selected tasks.
- Two small icon buttons open every summary and close every summary, and 1, 2 and 3 open the outline down to that level.
- Columns lists the schedule’s user fields, to show them as columns of the grid; Group by groups the rows by one of them; Filter shows only the tasks that have the values you tick. All three are greyed out for a schedule without user fields. Group by and Filter look pressed while they are on.
- Notes shows or hides a box under the chart with the notes of the last import or save.
The grid has the columns Task, Start, Finish, Duration, Float and Done, then the user fields you chose under Columns. Dates are written the way your Windows settings write them. A summary has a small mark before its name that closes and opens it. In the chart a red bar is a task on the critical path and a blue one is not, a thin bracket is a summary, an arrow is a relation, and the pale strip after a bar is the task’s total float, how far it can slip. The orange line is today. Select a task and the relations that decide where it starts are drawn thick, the others grey; rest the pointer on a bar or an arrow for a tip.
Showing the timeline you generated
The example is the schedule from the Generate Timeline section: the folder “UniFormat by Level”, the blueprint “UniFormat by level, with relations”, starting on the dialog’s default date, the day you generate it (17 November 2026 in the pictures, so your dates will differ).
- Generate the timeline as described under “Generating a timeline from an exported grouping”, with one difference: on the Blueprint step click the card UniFormat by level, with relations. The two Sequence cards on the Dates step are then greyed out, because the blueprint’s flow says how the tasks follow each other.
- Click Schedule on the Schedule panel. The pane shows the schedule at once. If the pane was already open it has updated itself; if it shows another schedule, click From timeline.
- Read the status line. It names the schedule and where it came from, then counts the rows and relations and gives the start and finish, and says how many tasks are tied to selection sets: here 132 rows (126 tasks under 6 summaries, one for each level), 396 relations, 17 November 2026 to 21 June 2027, and 126 of 126 tasks tied.
- Click 1 to see only the levels: “Sub Level” runs from 17 to 30 November 2026 and “01 - Entry Level” from 1 December 2026 to 8 March 2027. Click 3 or the open-all button to see the tasks again.
- Click Critical. The 107 critical tasks are selected in the chart and the elements of their 107 selection sets in the model, and the status line reads “Critical: 107 tasks, 107 tied to the model.” A critical task is one with no float: if it slips, the finish slips.
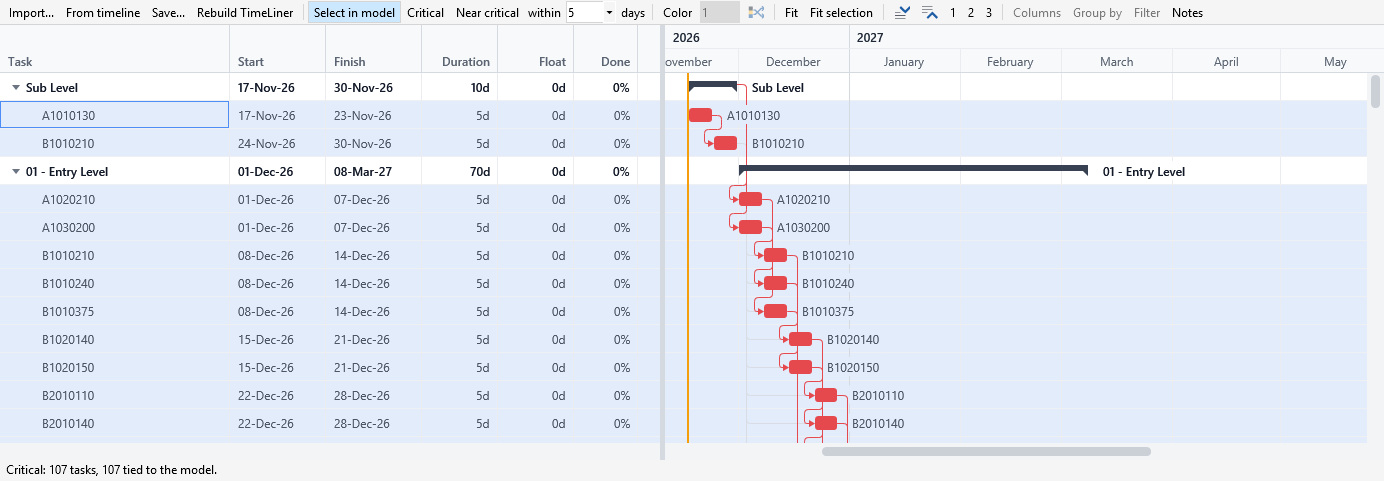
Critical*: the critical tasks are selected in the chart, and the status line reads “Critical: 107 tasks, 107 tied to the model.”*
- Click Near critical. With the default of 5 days it selects the 17 tasks that are not critical but have 5 days of float or less (“Near critical: 17 tasks, 17 tied to the model.”). Choose another number in the box and the pane says “Near critical is now within 10 working day(s) of float; Near critical selects those tasks.”
- Read the Float column. The levels and the critical tasks have none. On “02 - Floor”, for example, “D2020100” and “D2020200” start on 12 January 2027 and have 5 days of float: they can slip that much without moving 21 June 2027.
- Click any task to see what drives it. Click a row, or several with Ctrl or Shift, and with Select in model ticked the model follows when you stop for a moment: a summary stands for all the tasks below it.
Editing the schedule
You edit the chart with the mouse and the keyboard, and the schedule is calculated again after every edit. Ctrl+Z undoes the last edit and Ctrl+Y redoes it.
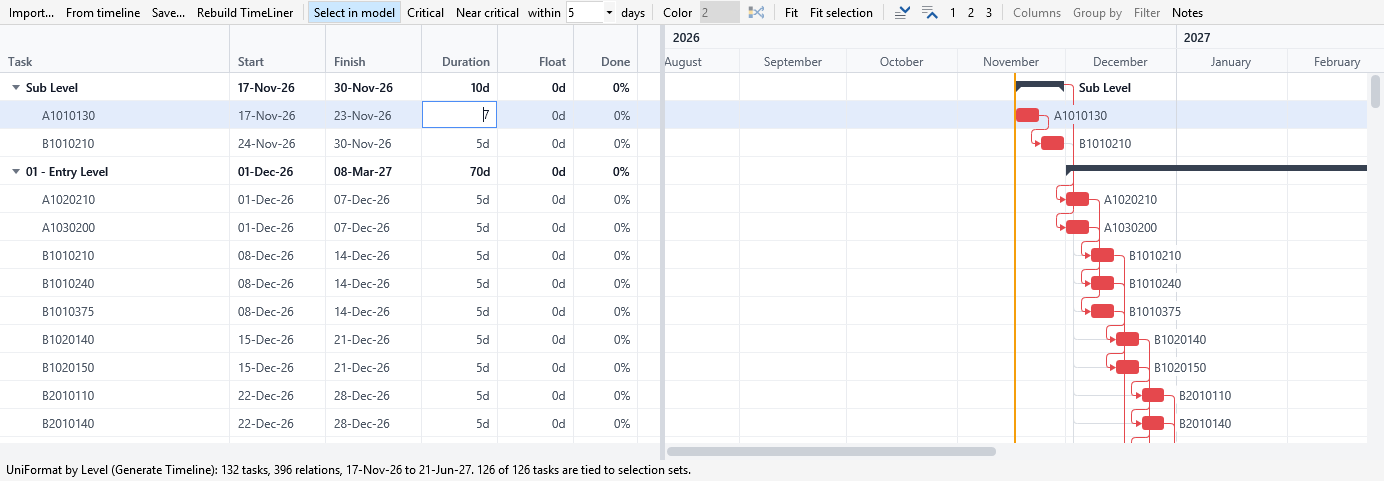
- Click the task “A1010130” under “Sub Level” (17 to 23 November 2026, 5 days).
- Press F2, then Tab three times to reach its Duration cell, or double-click the cell. Type
7. - Press Enter. “A1010130” now runs from 17 to 25 November 2026, “Sub Level” ends on 2 December, and the finish of the whole schedule moves two working days, from 21 June to 23 June 2027. The selection moves to the row below.
- Press Ctrl+Z. Everything is back where it was.
What else you can do in the chart:
- Type in any cell the same way: F2, a double click or just typing starts, Enter applies, Tab applies and goes to the next cell, Escape gives up. A cell that cannot be read stays open with a red frame. Float cannot be typed in, nor can the dates, duration and Done of a summary.
- Drag a bar to move the task. The drop gives the task the constraint “start no earlier than” that day. Drag the end of a bar to change its duration, and the small handle under a bar to set how far it is done.
- Draw a relation by dragging from the small ring beside the end of a bar to the left or right half of another bar: left is its start, right its finish. A relation that cannot be made (one that would close a loop, or a duplicate) is refused with a tip that says why. Double-click an arrow to change its type or lag, and select an arrow and press Delete to remove it.
- Insert adds a task above the selected row, “New task”, one day long. Delete removes the selected rows with what is below them; when that is more than the rows you selected, a box, Delete Tasks, asks first, says how many tasks go and that Ctrl+Z brings them back. Alt+Shift+Right and Alt+Shift+Left indent and outdent the selected rows.
- Ctrl with the mouse wheel, or + and -, zoom the chart around the pointer; dragging the chart moves it through time, and Fit shows the whole schedule again.
Editing changes the schedule in the pane, not the model and not TimeLiner. To put it in TimeLiner, use Rebuild TimeLiner; to keep it, use Save….
Colouring the schedule by level
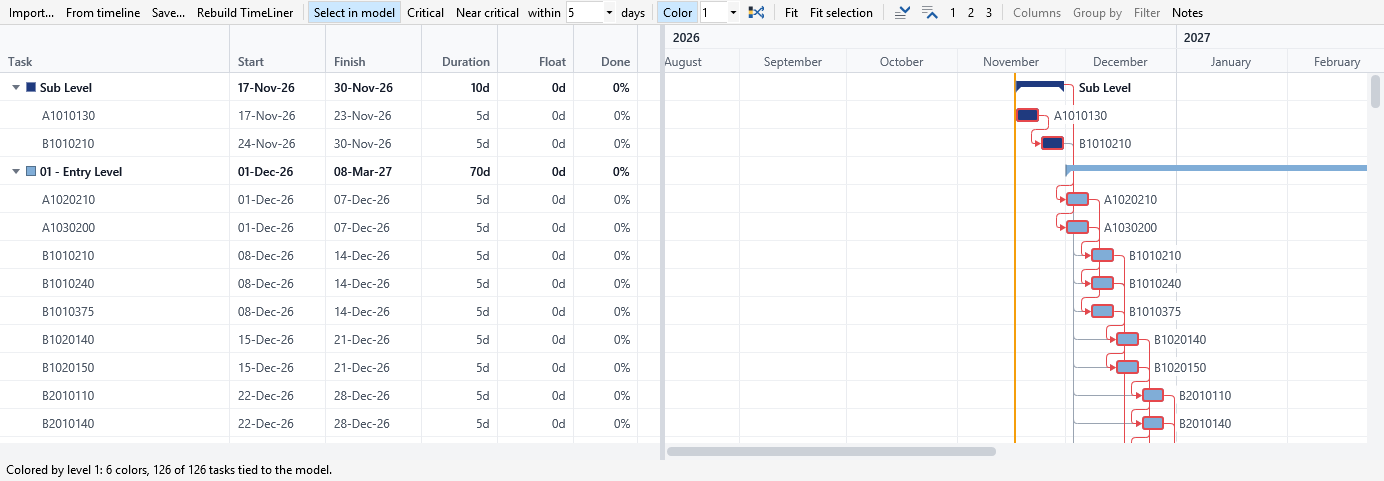
Color* on, level 1: each level’s tasks in the colour of the level, with the colour’s swatch before the level’s name in the grid.*
- Click Color. The level box and Shuffle colors wake up, and level 1 is coloured: “Colored by level 1: 6 colors, 126 of 126 tasks tied to the model.”
- Each task of that level, with everything below it, is drawn in one colour in the chart, with a small swatch of the colour before the level’s name in the grid. The elements of the selection sets the tasks are tied to are painted in the same colours in the model, and the view is made shaded so that they show.
- Choose 2 in the level box. The colours go to the next level down. Tasks that have the same name share a colour, so level 2 here has one colour for each UniFormat code, the same on every level: “Colored by level 2: 64 colors, 126 of 126 tasks tied to the model.”
- Click Shuffle colors for another palette. The colours stay with their names while you edit.
- Click Color again to take the colours off the model.
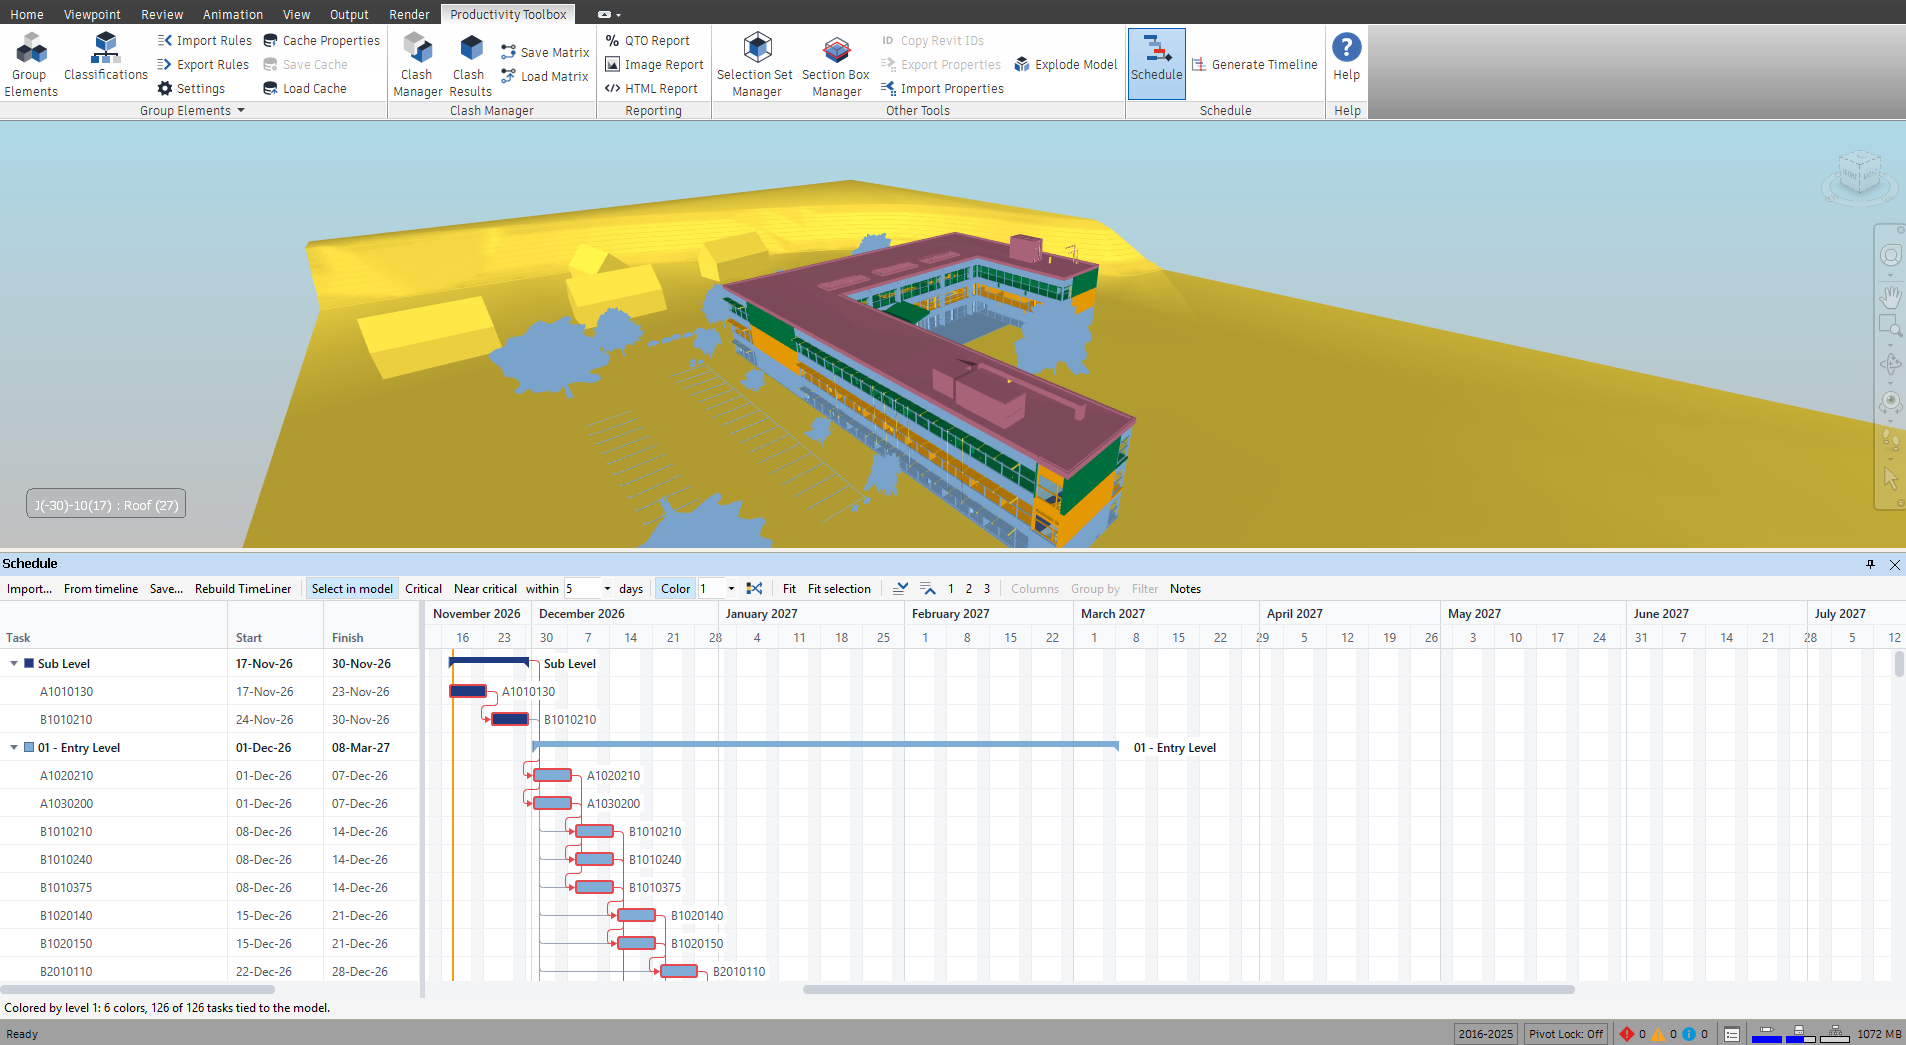
The colours are Group Elements’ palette, painted on the model the same way, so a colouring by Group Elements and one by this pane replace each other. Hiding the pane takes its colours off the model, and showing it paints them again.
Grouping and filtering by a user field
Columns, Group by and Filter work on the user fields that Primavera P6 calls activity codes and user-defined fields, and Microsoft Project calls custom fields. They read the fields from the file you import, so the schedule Generate Timeline builds has none and the three buttons stay greyed out. The example is a schedule imported from a P6 file that has two activity codes, Level and Trade (the UniFormat group of a task’s code: A Substructure, B Shell, C Interiors and so on).
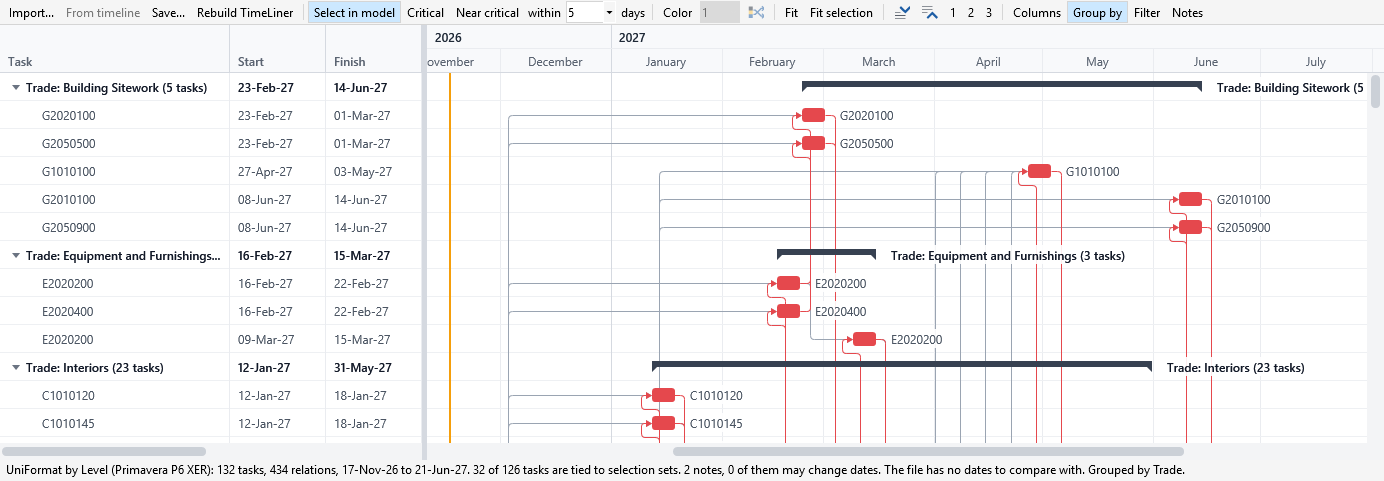
Trade*: a band for each value, the first here “Trade: Building Sitework (5 tasks)”, with the tasks that have it under the band.*
- Click Columns and tick Level and Trade. The menu stays open while you tick, and the fields show as columns after Done; widen the grid by dragging the line between it and the chart.
- Click Group by and choose Trade. The outline is replaced by a band for each trade, with its task count and the dates its tasks span, and the tasks under it; “Trade: Interiors (23 tasks)” holds the 23 tasks whose codes begin with C. A task with no value is in a last band, “(no value)”. The status line adds “Grouped by Trade.” Choose No grouping to get the outline back.
- Click Filter and point at Level. Its values are listed with the number of tasks that have each: “<No level> (21)”, “01 - Entry Level (34)”, “02 - Floor (31)” and so on. Tick 02 - Floor.
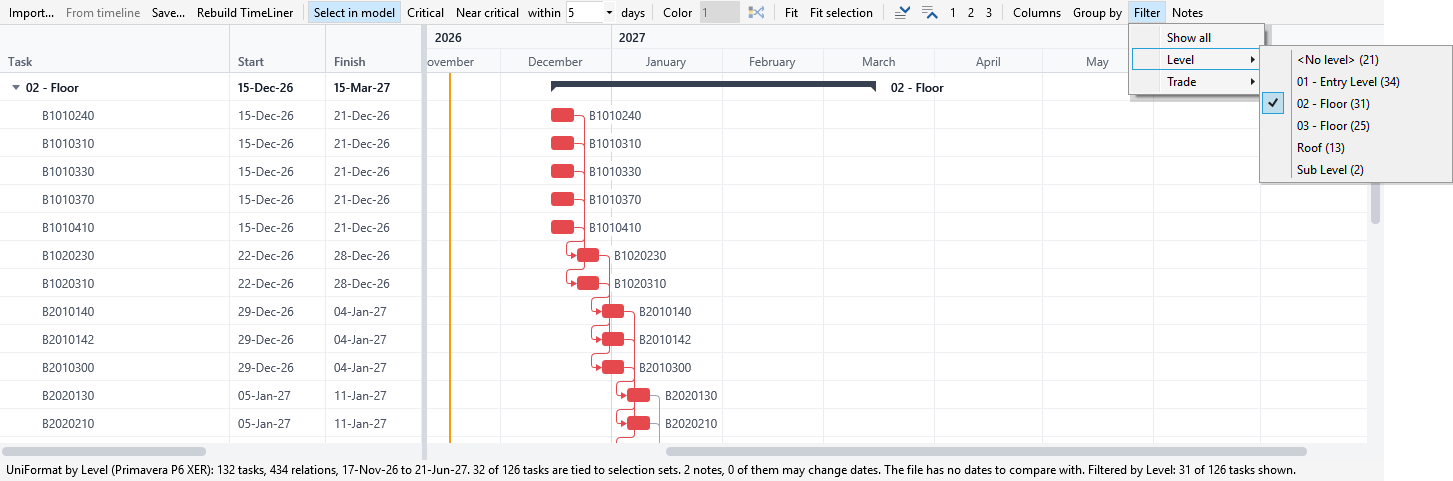
Filter* menu open on Level, “02 - Floor (31)” ticked; the chart shows only the tasks of that level.*
- The chart shows only the tasks of “02 - Floor”, with their summary above them, and the status line adds “Filtered by Level: 31 of 126 tasks shown.” Tick more values to add them, untick the last one or choose Show all to see every task again.
Grouping and filtering change the view only: the schedule is not changed, they are not saved with it, and they go away when another schedule is shown. While rows are grouped, Insert, indent and outdent do nothing, and while they are filtered Insert does nothing.
Importing a schedule and saving it back
- Click Import… and choose a file. A file that cannot be read is explained in a box, Import Schedule.
- The pane shows the schedule. The status line says where it came from (“UniFormat by Level (Primavera P6 XER)”), the counts, the start and finish, how many tasks are tied to selection sets, how many notes the import has and how many of them may change dates, and how many tasks have the dates the file gives. An XER file can hold several projects: the pane reads the one the file marks as exported (the largest if several are), and the status line says which.
- Click Notes to read what could not be read exactly as the other program has it, those that may change dates first.
- Edit the schedule if you wish, then click Save…, choose the file type (Schedule, Primavera P6 XER or Microsoft Project XML) and a name.
- For P6 and Project the notes box opens with what was written and what the format could not hold as
the schedule has it. Saving the example above as an XER reports “Saved as Primavera P6 XER: 132 tasks,
434 relations, 1 calendar.” and notes such as the project id P6 will show, the activity ids it needs
for every activity, and relations of summaries written as relations between the tasks below them. A
schedule file (
.json) holds everything.
Sending the schedule to TimeLiner and the model
- Click Rebuild TimeLiner. If TimeLiner already has tasks, a box, Rebuild TimeLiner, says how many, and asks: Yes replaces them with the schedule, No adds the schedule beside them, and Cancel writes nothing.
- TimeLiner gets a task for each task, with summaries as parents, the schedule’s dates as planned dates and the task type Generate Timeline gave them (for a schedule that has none, the default). Each task that is tied to a selection set is attached to it, so the simulation follows the set. The status line says what was written, for the example “126 tasks in 6 summaries written to TimeLiner in place of its tasks. 126 attached to selection sets.” One undo in Navisworks takes it back.
- Select tasks with Select in model ticked to see their elements in the model. A task is tied to a selection set in two ways: in a generated timeline, each task is tied to the set it was made from; in an imported schedule, a task is tied to the selection set that has its name, or its code, whatever the capitals. A name that two sets have is tied to neither.
Tips
- The schedule is not stored in the model: Save… it, or write it to TimeLiner, before you close Navisworks. Generating a timeline again replaces the schedule From timeline shows, edits included.
- The grid counts a working day as 9 hours (08:00 to 17:00) in a generated timeline and 8 hours in an imported schedule, so a five-day task of a timeline reads about 5.6 days once it is saved and imported again. The dates are exact.
- The grid opens narrow. Drag the line between the grid and the chart to the right to see Duration, Float, Done and the user fields.
- When selection sets are added, removed or renamed, or another model is opened or appended, the pane looks up the ties again, says how many tasks are tied now and repaints the colours. A generated task loses its tie when its set is deleted; an imported task follows the name.
- A task that is not tied to a set is drawn and edited like any other but selects nothing in the model. A task you add with Insert is not tied.
- Critical, Near critical, Color and Select in model need an open model; with none, the colours show in the chart only.
- What is being typed in a cell is applied before Save…, Rebuild TimeLiner or any other button acts; if it cannot be, the status line says so and the cell stays open until you correct it or press Escape.
- The P6 and Project files the pane writes have so far been checked with independent readers, not in P6 and Project themselves. If one does not open as you expect, or a file does not import, tell us (see “Getting help” in the introduction).
Something unclear or out of date in this chapter? Write to [email protected].