Reporting
Quantity take-offs to Excel or CSV, one image per group, and browsable HTML reports.
The Reporting panel turns the groups you have built in Group Elements into deliverables: a quantity take-off in Excel or CSV, a folder of rendered images, or a self-contained HTML report with a page per group. All three commands work from a grouping, so build or import at least one grouping first; until then the three buttons stay greyed out. Each command opens a small dialog, asks where to save, shows a progress bar you can cancel, and leaves your model exactly as you left it when it finishes.
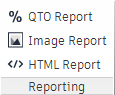
QTO Report
QTO Report sums numeric properties for every group of a grouping and writes the result as a table. Pick a grouping, tick the quantities you want (lengths, areas, volumes, counts, or any other number the model carries), choose the units, and the tool writes one row per group with the summed values and an element count. The output is either an Excel workbook with a ready-made pivot summary or a CSV file.
What it needs:
- at least one grouping in the Group Elements pane (the button is disabled otherwise);
- optionally a selection, if you want to read the property list from a selection instead of the whole model;
- optionally a property cache (Cache Properties or Load Cache), which fills the category and property lists as soon as the dialog opens.
The Quantity Take-off Export dialog at a glance
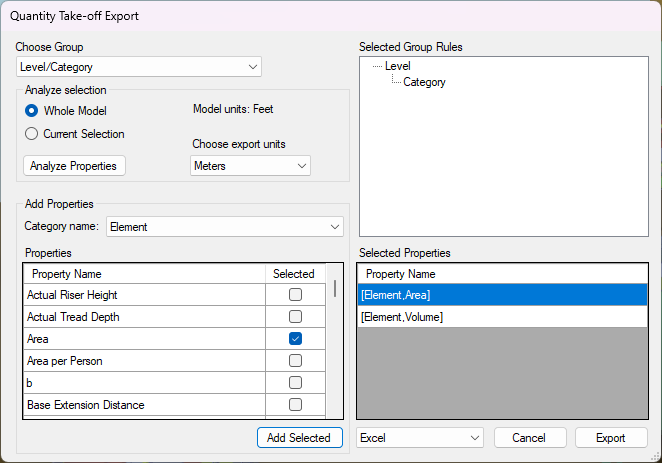
- Choose Group lists every grouping in the Group Elements pane. It opens with nothing chosen, so pick the grouping you want to quantify first; the rest of the dialog only makes sense once you have.
- Selected Group Rules shows the rules of that grouping as a chain, the first rule at the top and each further rule one level deeper, so a Level/Category grouping reads “Level” with “Category” indented under it. It is read-only; it tells you which columns the table will have.
- Analyze selection holds the scan options, the unit boxes and a button:
- Whole Model reads the property names of every element in the model. This is preselected when nothing is selected.
- Current Selection reads only the selected elements. This is preselected when you had a selection before opening the dialog.
- Analyze Properties scans the chosen scope and fills the category list. A progress bar titled “Analyzing properties” runs while it works and can be cancelled. A whole-model scan is remembered for the rest of the session, so the next dialog that needs it opens ready. If you have run Cache Properties or Load Cache, the lists are already filled when the dialog opens and you can skip this step.
- Model units: is a read-only line that names the units of the open model, for example “Model units: Feet”.
- Choose export units lists every unit Navisworks knows. It is preset to the model’s own units; in the picture it has been changed to Meters. Values that carry a unit are converted into the unit you choose.
- Add Properties is where you pick the quantities:
- Category name: lists the property categories found, in alphabetical order (for example Element, Revit Type, Item).
- Properties is a grid with a Property Name column and a Selected check box column, listing the properties of the chosen category alphabetically. Only properties that hold a number are listed.
- Add Selected copies every ticked property into the list on the right. A property that is already in the list is not added twice.
- Selected Properties lists the category and property pairs that will become columns, written as “[Category,Property]” (for example “[Element,Area]”), in the order you added them.
- The unlabelled drop-down at the bottom picks the file type: Excel or CSV.
- Export asks where to save and starts the export. Cancel closes the dialog without writing anything.
What the report contains
Every row is one group at the deepest level of the grouping. The columns, from left to right:
- [Rule]: the name of the grouping.
- One column per grouping rule, named after the rule, holding the group name at that level. A rule on one of the built-in properties is named after it (“Level”, “Category”, “Workset”); a rule on any other property is named “Category/Property”. Elements that had no value for a rule are reported in a group called “[UNDEFINED]”.
- One column per selected property, named “[Category/Property]” (for example “[Element/Area]”), holding the sum of that property over all elements of the group, in the export units.
- [Count]: the number of elements in the group.
Elements whose property is empty or not a number are skipped for that column but still counted in [Count].
An Excel export has two sheets:
- QTO Export: the table above as a formatted Excel table, with the column widths fitted to the content.
- QTO Summary: a pivot table over that table, with every text column as a row field and every numeric column summed, so you can collapse or expand the levels directly in Excel.
![The QTO Export sheet of a take-off of a one-rule Workset grouping, with the columns [Rule], Workset, [Element/Area], [Element/Volume] and [Count], and the QTO Summary sheet on the tab beside it.](/guide/images/32-qto-excel-output.png)
A CSV export is a plain comma-separated file in UTF-8 with a first line that tells Excel the separator, so it opens correctly by double-click on any language of Excel and numbers keep the decimal point.
Where it is written and how long it takes
After Export, a save dialog titled “Save QTO Export to Excel File” (or ”… to CSV File”) opens on your Desktop; choose any folder and file name. A progress bar titled “QTO Exporting” then advances one step per group and has a Cancel button; cancelling writes nothing. The time depends on the number of elements in the grouping, since every element is read once for all requested properties. When the file is written it opens straight away in the application associated with .xlsx or .csv.
Quantity take-off by level and category to Excel
- In Group Elements, build a grouping with two rules, level first and category second, and name it Level/Category, so the take-off gets one row per level and category.
- Run Cache Properties on the Group Elements panel if you have not yet done so; the QTO dialog will then open with its lists already filled.
- Click QTO Report on the Reporting panel.
- Under Choose Group, pick Level/Category. Check in Selected Group Rules that “Level” is on top and “Category” indented below it.
- Leave Whole Model selected. If the category list is empty, click Analyze Properties and wait for the scan to finish.
- Under Category name: choose the category that holds the quantity, for example “Element”.
- In the Properties grid, tick Selected next to “Area”, click Add Selected, then scroll down, tick “Volume” and click Add Selected again. Both appear under Selected Properties as “[Element,Area]” and “[Element,Volume]”.
- The model in the picture is in feet, as Model units: shows. Under Choose export units choose “Meters” so the quantities are converted, or leave the model units to keep them as they are.
- Leave the file type on Excel and click Export.
- Choose a folder and file name in the save dialog and click Save. Wait for the “QTO Exporting” progress bar to finish.
- The workbook opens in Excel. Read the totals on the QTO Summary sheet, or filter the QTO Export table by level.
Tips
- Only numeric properties are offered. A quantity stored as text (for example a Revit parameter exported as a string) will not appear in the Properties grid.
- Unit conversion applies to values that carry a unit, such as lengths, areas and volumes. Plain numbers without a unit are summed as they are, whatever you choose under Choose export units.
- The rows are the groups at the deepest level only. To get subtotals per upper level, use the QTO Summary pivot or add your own subtotals in Excel.
- Groups that share the same name at the deepest level but sit under different parents stay separate rows, because each row also carries the parent names.
- You can add properties from several categories: change Category name:, tick more properties and click Add Selected again.
- If nothing is listed under Selected Properties, the export still runs and gives you the group names and [Count] only, which is a quick way to count elements per group.
Image Report
Image Report renders one picture per group into a folder. For every group of the chosen level the tool isolates the group in the 3D window (or dims everything else), optionally zooms to it, takes a picture at the size you set and saves it as JPG, PNG or BMP. You can stamp each image with the grouping name and group name.
What it needs: at least one grouping. Nothing has to be selected. The groups are taken from the level you choose, so the pictures match the colouring level of the Group Elements pane.
The Image Report dialog at a glance
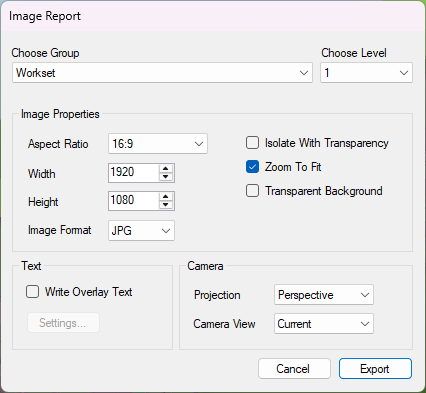
- Choose Group, at the top left, lists the groupings in pane order; the first one is picked for you.
- Choose Level, at the top right, lists the levels of that grouping (1 for the first rule, 2 for the second, and so on). The level that is currently coloured in the Group Elements pane is preselected; a grouping that was never coloured is set to level 1. Changing the level recolours the model immediately, exactly as the level box in the pane does, and the report uses that level: one image per distinct group name at that level.
- Image Properties, in the order the box lists them:
- Aspect Ratio: 16:9 (the default), 4:3, 1:1 or Custom. With a fixed ratio, changing Width adjusts Height and the other way round; Custom leaves both free.
- Width and Height in pixels, from 1 to 10000. The default is 1920 by 1080.
- Image Format: JPG (the default), PNG or BMP.
- Isolate With Transparency (unticked by default) keeps the rest of the model visible but grey and 95 % transparent instead of hiding it, so each group is shown in context.
- Zoom To Fit (ticked by default) zooms the camera onto each group before the picture is taken. Untick it to keep the camera exactly where you left it and shoot every group from that same position.
- Transparent Background (unticked by default) turns pure black pixels of the image transparent.
- Text
- Write Overlay Text (unticked by default) stamps two lines on every image: “Rule Name: <grouping>” and “<rule>: <group name>”.
- Settings… is greyed out until that box is ticked; it then opens the Text Position dialog.
- Camera
- Projection: Perspective (the default) or Orthographic.
- Camera View: Current (the default), Top, Front, Right or Standard (a front-right-top isometric). It is applied only when Zoom To Fit is ticked.
- Export asks for a folder and starts rendering; Cancel closes the dialog.
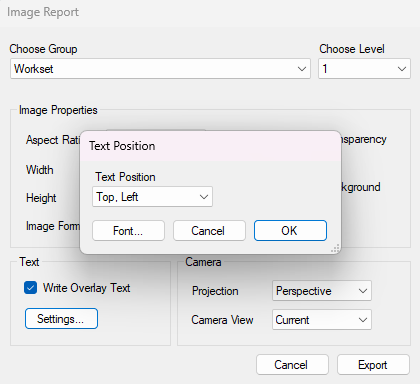
The Text Position dialog has:
- Text Position: “Top, Left” (the default), “Bottom, Left”, “Top, Right” or “Bottom, Right”.
- Font… opens the Windows font dialog, where you also choose the text colour.
- Cancel and OK. If you never open this dialog, the text is drawn in 12 pt Tahoma in the top-left corner.
What it produces
After Export, a folder browser opens (starting at the Desktop, with a “Make New Folder” button). The images are written straight into the folder you choose, named image_1, image_2, … in the order of the groups, with the extension .jpeg, .png or .bmp. Groups that share a name at the chosen level are merged into one image.
A progress bar titled “Generating report…” advances one step per group and can be cancelled; the images written so far are kept. When the run ends a message box titled “Image Report” tells you how many images were saved (or after how many groups it was cancelled) and repeats the folder path. The model is then put back the way it was: hidden elements, temporary colours and transparency are reset, the group colours are painted back on and the camera returns to where it was.
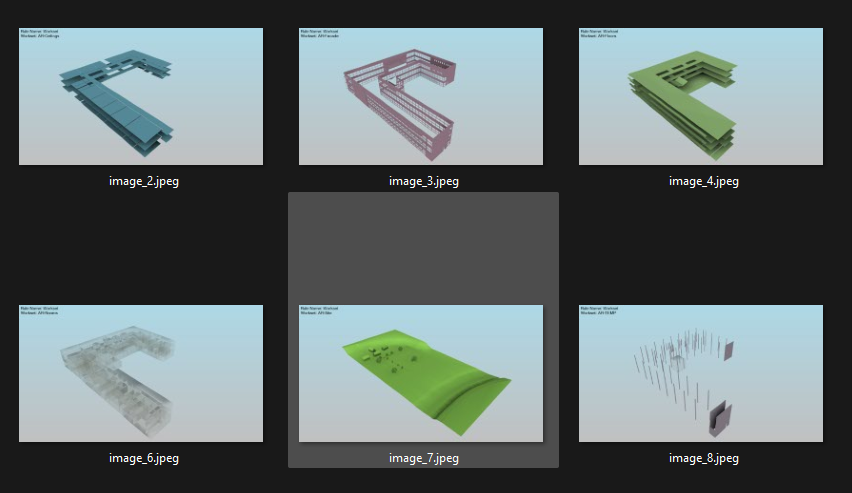
Rendering one image per workset
- In Group Elements, build a grouping with a single workset rule, name it Workset and colour it.
- Click Image Report.
- Under Choose Group pick Workset; Choose Level shows 1, the only level this grouping has.
- Leave Aspect Ratio at 16:9, Width at 1920, Height at 1080 and Image Format at JPG.
- Leave Isolate With Transparency unticked, so every workset is shown on its own, and Zoom To Fit ticked, so each one fills the picture.
- Leave Projection on Perspective and Camera View on Current.
- Tick Write Overlay Text, click Settings…, leave Text Position on “Top, Left”, optionally click Font… to change the font or the colour, then click OK.
- Click Export, choose or create a folder and click OK.
- Wait for the progress bar; the 3D window will flick through the worksets while it renders.
- Read the “Image Report” message and open the folder; the images are named
image_1.jpeg,image_2.jpegand so on.
Tips
- Transparent Background only makes black pixels transparent. Set the Navisworks background to a plain black colour first, and choose PNG, which keeps transparency; JPG does not.
- With Zoom To Fit unticked the camera is not moved at all, so Camera View has no effect and every image shows the same viewpoint. Set up the view you want before clicking Image Report.
- With Zoom To Fit ticked and Isolate With Transparency unticked, the zoom is done on the isolated group; with Isolate With Transparency ticked, the camera zooms onto the group’s elements while the rest of the model remains visible.
- The pictures are rendered in the active 3D window, so the render style, lighting and background you see there are what you get. Do not use Navisworks while the report is running.
- Very large sizes (up to 10000 pixels a side) take much longer to render and produce large files; 1920 by 1080 is enough for a presentation.
- A level can be picked in the dialog without changing the grouping: the choice is stored on the grouping and the Group Elements pane follows it.
HTML Report
HTML Report renders four views of every group and puts them in a printable report: a cover page, a clickable contents page and one A4 page per group with the group’s colour, its element count and a perspective (or orthographic) view plus Top, Front and Right views. The report is a single index.html that needs no internet connection; the images sit in a folder next to it or, if you prefer one file to send, inside it.
What it needs: at least one grouping. Nothing has to be selected.
The HTML Report dialog at a glance
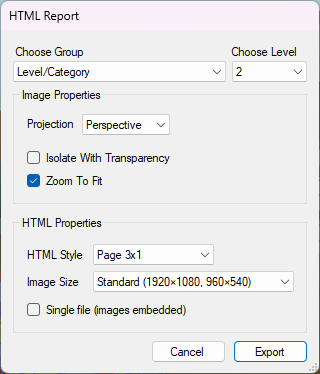
- Choose Group and Choose Level work exactly as in the Image Report: pick the grouping, then the level whose groups become pages. Changing the level recolours the model straight away.
- Image Properties
- Projection: Perspective (the default) or Orthographic, used for the large 3D view.
- Isolate With Transparency (unticked by default) shows the rest of the model grey and transparent instead of hiding it.
- Zoom To Fit (ticked by default) zooms onto each group for the 3D view. Untick it to shoot the 3D view of every group from the camera position you set before opening the dialog.
- HTML Properties
- HTML Style: Page 3x1 is an A4 portrait page with the 3D view on top, a row of Top, Front and Right views below and a Notes box for handwritten remarks after printing. Page 2x2 is an A4 landscape page with Top, Right, Front and 3D views in a two-by-two grid.
- Image Size: Standard (1920×1080, 960×540) or Compact (1280×720, 640×360). The first size is the 3D view, the second the three orthographic views. Compact is about four times smaller on disk.
- Single file (images embedded): unticked, the report is
index.htmlplus animagesfolder; ticked, the images are embedded and the report is oneindex.htmlyou can attach to an e-mail.
- Export asks for a folder and starts rendering; Cancel closes the dialog.
What it produces
After Export, a folder browser opens (starting at the Desktop). The report is written into the folder you choose:
index.html: the whole report: styles, pages and the full-screen viewer are inside it, nothing is loaded from the internet.images\: only when Single file is unticked: four JPG files per group,image_1_3D.jpg,image_1_Top.jpg,image_1_Front.jpg,image_1_Right.jpg, and so on.
A small bar floats in the top right corner of the browser window, above the pages, with a Contents link that jumps to the contents page and a Print / Save as PDF button that prints one group per page. It is never printed.
The pages of the report:
- Cover: a colour strip of all groups across the top, the label “Group Elements report”, the grouping name as title, the model file name, then three boxes reading Groups, Elements and Generated with the group and element counts and the date and time of the run, and finally Grouping rules, the numbered list of the rules with the chosen level tagged “Report level”. The footer reads “Productivity Toolbox for Navisworks” and “Page 1”.
- Contents: one line per group with its colour dot, name, element count and page number; every line links to its page. A long report gets several contents pages.
- One page per group: a colour swatch, the name of the rule at the report level and “Group N of M”, the group name, the element count, the views with their captions, and a footer with the grouping name, the model file name and the page number. Click any view to open it full screen; the left and right arrow keys step to the previous or next view and Escape closes it.
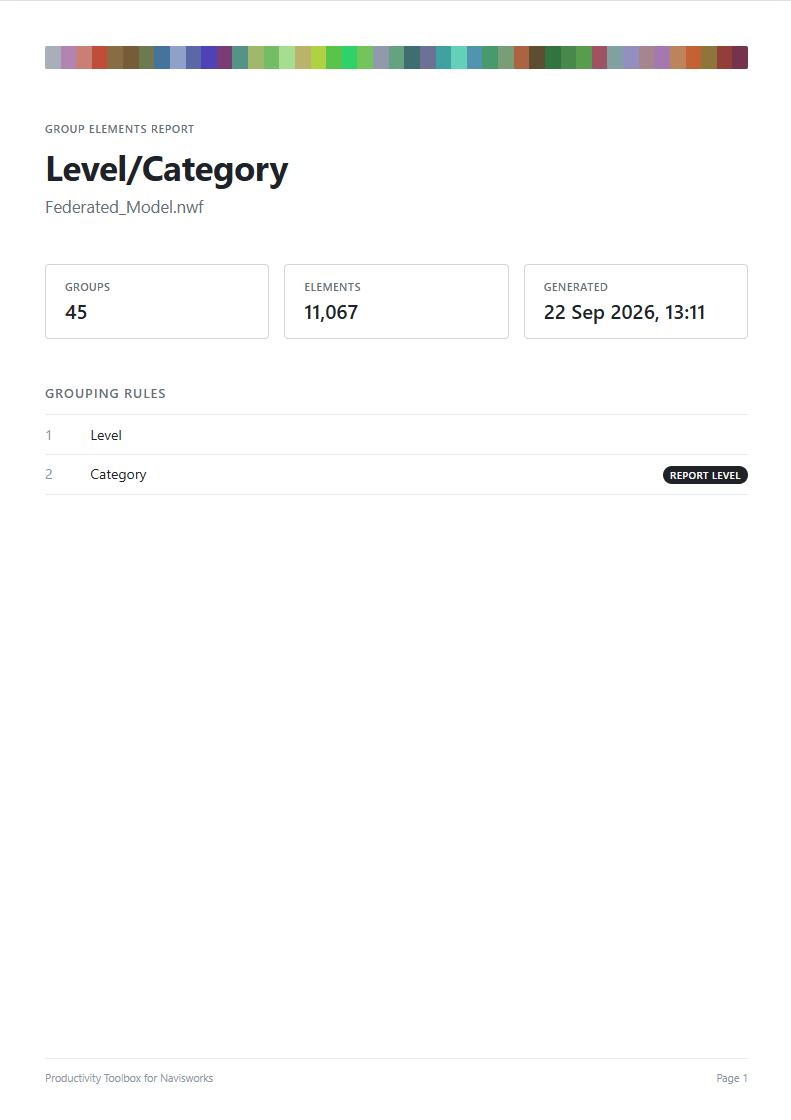
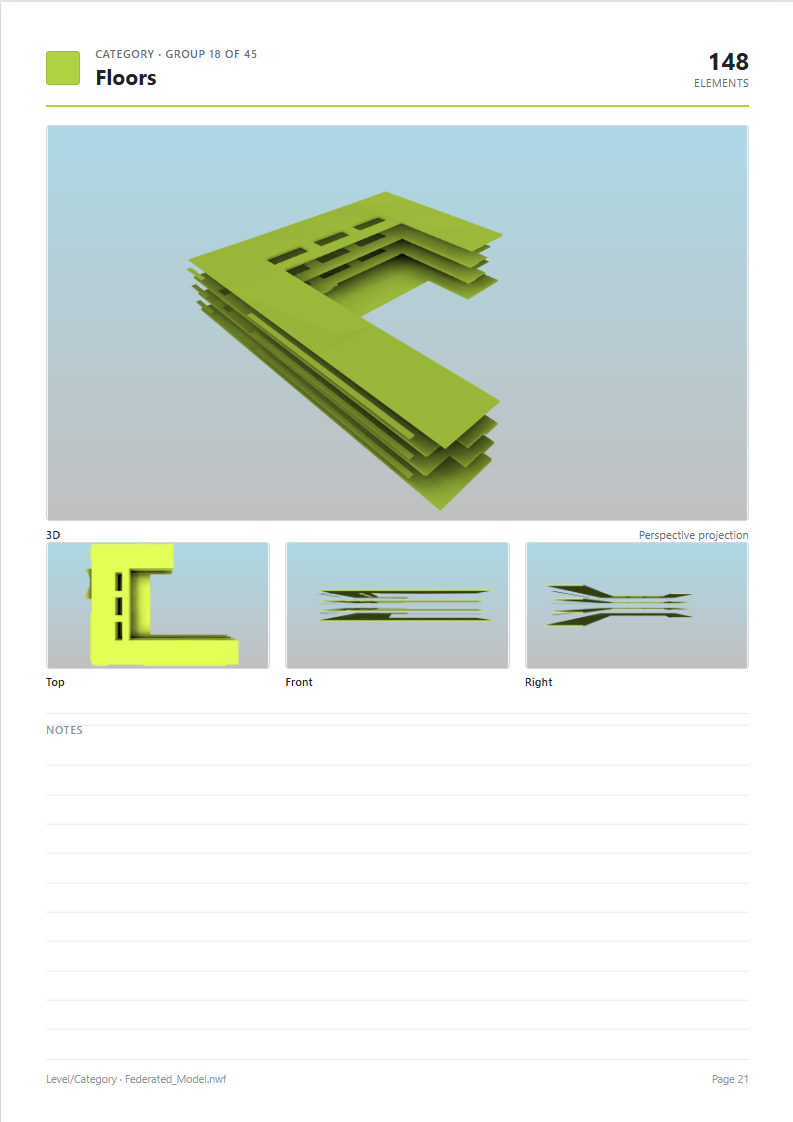
A progress bar titled “Generating report…” advances one step per group and can be cancelled; the pages generated so far are saved. When the run ends a message box titled “HTML Report” states how many groups were written, the folder, and the size: “Single file: index.html, 13.4 MB.” or “Folder: index.html plus images, 9.8 MB in total.” If the report is larger than 25 MB the message carries a warning icon and suggests the Compact image size or sharing through a file link, because most e-mail services reject attachments of that size. As with the Image Report, the model and the camera are restored afterwards.
An HTML coordination report of one grouping
- In Group Elements, build the Level/Category grouping, level first and category second, and colour it at level 2 so each category per level has its own colour.
- Set up the 3D window: choose a render style and background you like, since the views are captured from that window.
- Click HTML Report.
- Under Choose Group pick Level/Category and under Choose Level pick 2. The model recolours to confirm the level.
- Leave Projection on Perspective, Isolate With Transparency unticked so each category is shown on its own, and Zoom To Fit ticked.
- Leave HTML Style on Page 3x1, the A4 portrait page with a Notes box.
- Leave Image Size on Standard (1920×1080, 960×540) and Single file (images embedded) unticked, so the report is
index.htmlplus animagesfolder. - Click Export, choose or create a folder and click OK.
- Wait for the “Generating report…” bar; four views are rendered per group.
- Read the “HTML Report” message; it names the folder and the size of the report.
- Open
index.htmlin a browser to check it. The recipient needs nothing but a browser. - To send the report by e-mail instead, run it again with Image Size on Compact (1280×720, 640×360) and Single file (images embedded) ticked, then attach the single
index.html. If the message warns that the report is larger than 25 MB, share it through a file link instead.
Printing the report to PDF
- Generate the report with Page 3x1 and Standard image size.
- Open
index.htmlin a browser and click Print / Save as PDF on the cover. - In the print dialog choose “Save as PDF” and keep A4 portrait; each group lands on its own page and the contents page numbers match.
Tips
- Zoom To Fit unticked keeps your camera for the 3D view of every group, which gives a consistent series of pictures from one viewpoint. The Top, Front and Right views are always aimed automatically and zoomed to the group.
- Standard and Compact differ only in image size and compression; the page layout is the same. Choose Compact for e-mail and Standard for printing.
- Ticking Single file does not change what the report looks like; it only decides whether the images are separate files. A single-file report is a little larger than the folder version because embedded images take about a third more space.
- The images are lazily loaded, so a report with a hundred groups still opens quickly; only the pages you scroll to are decoded.
- The group colour on each page comes from the grouping’s colouring. Colour the grouping in Group Elements before running the report, otherwise the swatches are grey.
- Groups that share a name at the chosen level are merged into one page, the same way the Image Report merges them into one image.
- Do not use Navisworks while the report is running; every view is rendered in the active 3D window.
Something unclear or out of date in this chapter? Write to [email protected].